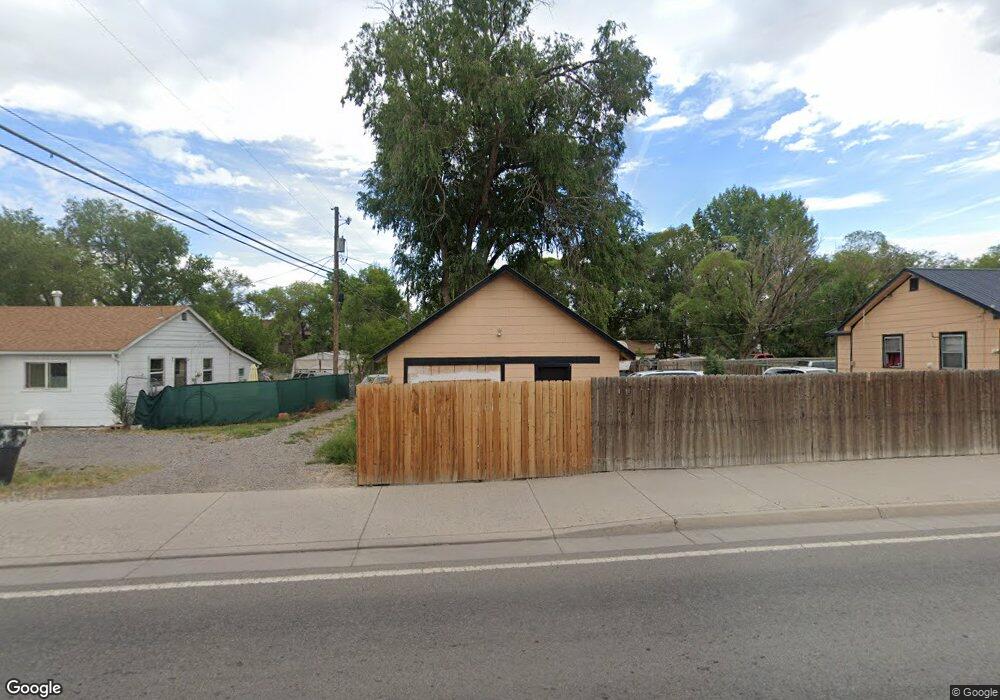
1303 N 1st St Montrose, CO 81401
Estimated Value: $217,000 - $306,000
2
Beds
1
Bath
864
Sq Ft
$323/Sq Ft
Est. Value
About This Home
This home is located at 1303 N 1st St, Montrose, CO 81401 and is currently estimated at $279,107, approximately $323 per square foot. 1303 N 1st St is a home located in Montrose County with nearby schools including Johnson Elementary School, Centennial Middle School, and Montrose High School.
Ownership History
Date
Name
Owned For
Owner Type
Purchase Details
Closed on
May 23, 2008
Sold by
Rocky Mountain Pacific Llc
Bought by
Marck Neil
Current Estimated Value
Home Financials for this Owner
Home Financials are based on the most recent Mortgage that was taken out on this home.
Original Mortgage
$124,000
Outstanding Balance
$78,570
Interest Rate
5.89%
Mortgage Type
New Conventional
Estimated Equity
$200,537
Purchase Details
Closed on
Jul 29, 2005
Sold by
Patterson David
Bought by
Rocky Mountain Pacific Llc
Home Financials for this Owner
Home Financials are based on the most recent Mortgage that was taken out on this home.
Original Mortgage
$122,850
Interest Rate
5.61%
Mortgage Type
New Conventional
Purchase Details
Closed on
Mar 11, 1983
Sold by
Highlander Koa
Bought by
Beane Billy J and Beane Carolyn Beane
Purchase Details
Closed on
Jul 20, 1979
Sold by
Velasquez Abelino and Velasquez Ralphie
Bought by
Beane Billy J and Beane Carolyn Beane
Create a Home Valuation Report for This Property
The Home Valuation Report is an in-depth analysis detailing your home's value as well as a comparison with similar homes in the area
Home Values in the Area
Average Home Value in this Area
Purchase History
| Date | Buyer | Sale Price | Title Company |
|---|---|---|---|
| Marck Neil | $155,000 | Security Title | |
| Rocky Mountain Pacific Llc | -- | Security Title | |
| Patterson David | -- | Security Title | |
| Patterson David | $136,500 | Security Title | |
| Beane Billy J | -- | -- | |
| Beane Billy J | $20,000 | -- |
Source: Public Records
Mortgage History
| Date | Status | Borrower | Loan Amount |
|---|---|---|---|
| Open | Marck Neil | $124,000 | |
| Previous Owner | Patterson David | $122,850 |
Source: Public Records
Tax History Compared to Growth
Tax History
| Year | Tax Paid | Tax Assessment Tax Assessment Total Assessment is a certain percentage of the fair market value that is determined by local assessors to be the total taxable value of land and additions on the property. | Land | Improvement |
|---|---|---|---|---|
| 2024 | $880 | $12,360 | $3,550 | $8,810 |
| 2023 | $880 | $16,640 | $4,780 | $11,860 |
| 2022 | $842 | $12,230 | $3,480 | $8,750 |
| 2021 | $867 | $12,580 | $3,580 | $9,000 |
| 2020 | $706 | $10,520 | $3,090 | $7,430 |
| 2019 | $710 | $10,520 | $3,090 | $7,430 |
| 2018 | $573 | $8,280 | $2,490 | $5,790 |
| 2017 | $569 | $8,280 | $2,490 | $5,790 |
| 2016 | $536 | $7,940 | $2,510 | $5,430 |
| 2015 | $527 | $7,940 | $2,510 | $5,430 |
| 2014 | $473 | $7,630 | $2,510 | $5,120 |
Source: Public Records
Map
Nearby Homes
- TBD N Cedar
- 218 N Stough Ave
- 338 N Stough Ave
- 1037 N 1st St
- 505 Miami Rd
- 383 S Hillcrest Dr Unit 62
- 383 S Hillcrest Dr Unit 30
- 701 N 4th St
- 700 N Nevada Ave
- TBD S 4th St
- 512 N 5th St
- 1512 Branding Iron Dr
- 1315 Pitchfork Rd
- 1367 Corral Dr
- TBD Lot 11 E Star Ct
- TBD Lot 9 E Star Ct
- TBD Lot 10 E Star Ct
- TBD Lot 12 E Star Ct
- 1201 N San Juan Ave
- 806 N Park Ave