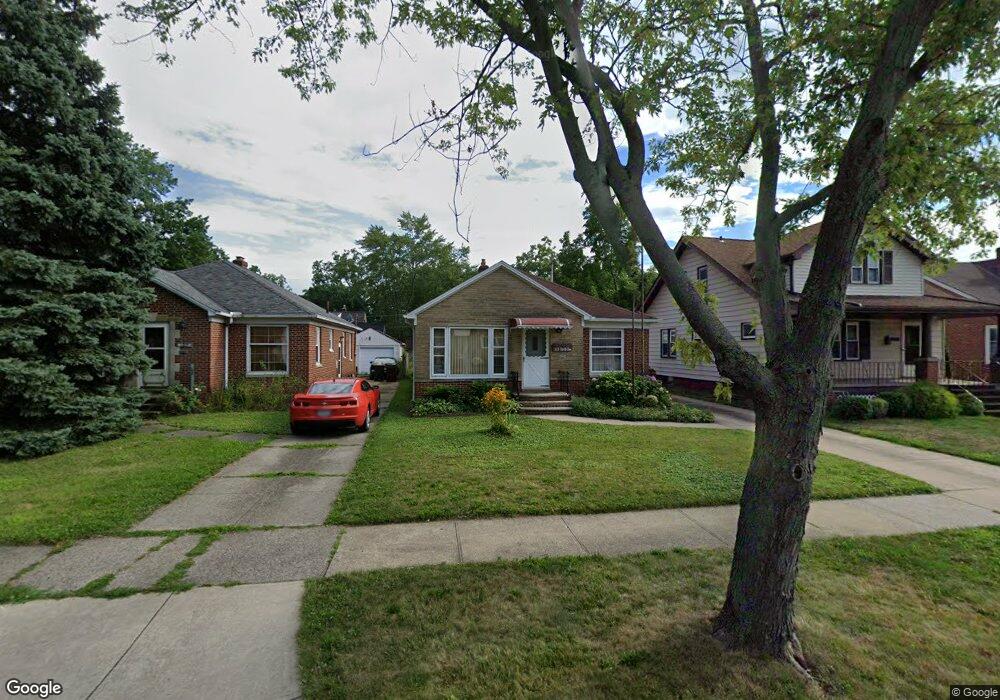
1303 North Ave Cleveland, OH 44134
Estimated Value: $197,269 - $240,000
3
Beds
2
Baths
1,224
Sq Ft
$178/Sq Ft
Est. Value
About This Home
This home is located at 1303 North Ave, Cleveland, OH 44134 and is currently estimated at $218,317, approximately $178 per square foot. 1303 North Ave is a home located in Cuyahoga County with nearby schools including John Muir Elementary School, Hillside Middle School, and Normandy High School.
Ownership History
Date
Name
Owned For
Owner Type
Purchase Details
Closed on
May 31, 2011
Sold by
Nicholas Peggy Ann
Bought by
Rossoll Kenneth
Current Estimated Value
Home Financials for this Owner
Home Financials are based on the most recent Mortgage that was taken out on this home.
Original Mortgage
$71,200
Outstanding Balance
$49,496
Interest Rate
4.81%
Mortgage Type
New Conventional
Estimated Equity
$168,821
Purchase Details
Closed on
Jun 30, 2010
Sold by
Rossoll William D and Rossoll Margaret T
Bought by
Rossoll Margaret T
Purchase Details
Closed on
Dec 28, 1988
Sold by
Kovacs Richard W
Bought by
Rossoll William D
Purchase Details
Closed on
Mar 18, 1985
Sold by
Kenski Antoinette L
Bought by
Kovacs Richard W
Purchase Details
Closed on
Jun 8, 1979
Sold by
Solkiewicz Frances
Bought by
Kenski Antoinette L
Purchase Details
Closed on
Jan 1, 1975
Bought by
Solkiewicz Frances
Create a Home Valuation Report for This Property
The Home Valuation Report is an in-depth analysis detailing your home's value as well as a comparison with similar homes in the area
Home Values in the Area
Average Home Value in this Area
Purchase History
| Date | Buyer | Sale Price | Title Company |
|---|---|---|---|
| Rossoll Kenneth | $100,000 | Real Estate Title | |
| Rossoll Margaret T | -- | None Available | |
| Rossoll William D | $74,000 | -- | |
| Kovacs Richard W | -- | -- | |
| Kenski Antoinette L | $54,000 | -- | |
| Solkiewicz Frances | -- | -- |
Source: Public Records
Mortgage History
| Date | Status | Borrower | Loan Amount |
|---|---|---|---|
| Open | Rossoll Kenneth | $71,200 |
Source: Public Records
Tax History Compared to Growth
Tax History
| Year | Tax Paid | Tax Assessment Tax Assessment Total Assessment is a certain percentage of the fair market value that is determined by local assessors to be the total taxable value of land and additions on the property. | Land | Improvement |
|---|---|---|---|---|
| 2024 | $3,654 | $60,340 | $10,010 | $50,330 |
| 2023 | $2,938 | $41,160 | $7,700 | $33,460 |
| 2022 | $2,910 | $41,160 | $7,700 | $33,460 |
| 2021 | $2,992 | $41,160 | $7,700 | $33,460 |
| 2020 | $2,621 | $31,640 | $5,920 | $25,730 |
| 2019 | $2,507 | $90,400 | $16,900 | $73,500 |
| 2018 | $2,338 | $31,640 | $5,920 | $25,730 |
| 2017 | $2,316 | $26,960 | $4,870 | $22,090 |
| 2016 | $2,302 | $26,960 | $4,870 | $22,090 |
| 2015 | $2,189 | $26,960 | $4,870 | $22,090 |
| 2014 | $2,189 | $27,510 | $4,970 | $22,540 |
Source: Public Records
Map
Nearby Homes
- 5231 W 16th St
- 1716 Tuxedo Ave
- 5085 W 6th St
- 5554 Landover Ct Unit 282
- 5553 Sunset Ln Unit A15-F
- 5118 W 4th St
- 2129 North Ave
- 4884 W 13th St
- 4859 W 13th St
- 2302 Brookdale Ave
- 317 Park Dr
- 2137 Silverdale Ave
- 2503 Brookdale Ave
- 2446 Fortune Ave
- 2506 Fortune Ave
- 1917 Alvin Ave
- 4771 S Hills Dr
- 2923 Brookview Blvd
- 2712 Ralph Ave
- 2831 Walbrook Ave
- 1219 North Ave
- 1311 North Ave
- 1213 North Ave
- 1315 North Ave
- 1306 Tuxedo Ave
- 1214 Tuxedo Ave
- 1310 Tuxedo Ave
- 1319 North Ave
- 1207 North Ave
- 1210 Tuxedo Ave
- 1314 Tuxedo Ave
- 1302 North Ave
- 1218 North Ave
- 1306 North Ave
- 1403 North Ave
- 1214 North Ave
- 1203 North Ave
- 1310 North Ave
- 1206 Tuxedo Ave
- 1318 Tuxedo Ave