Estimated Value: $370,155 - $437,000
4
Beds
3
Baths
2,264
Sq Ft
$173/Sq Ft
Est. Value
About This Home
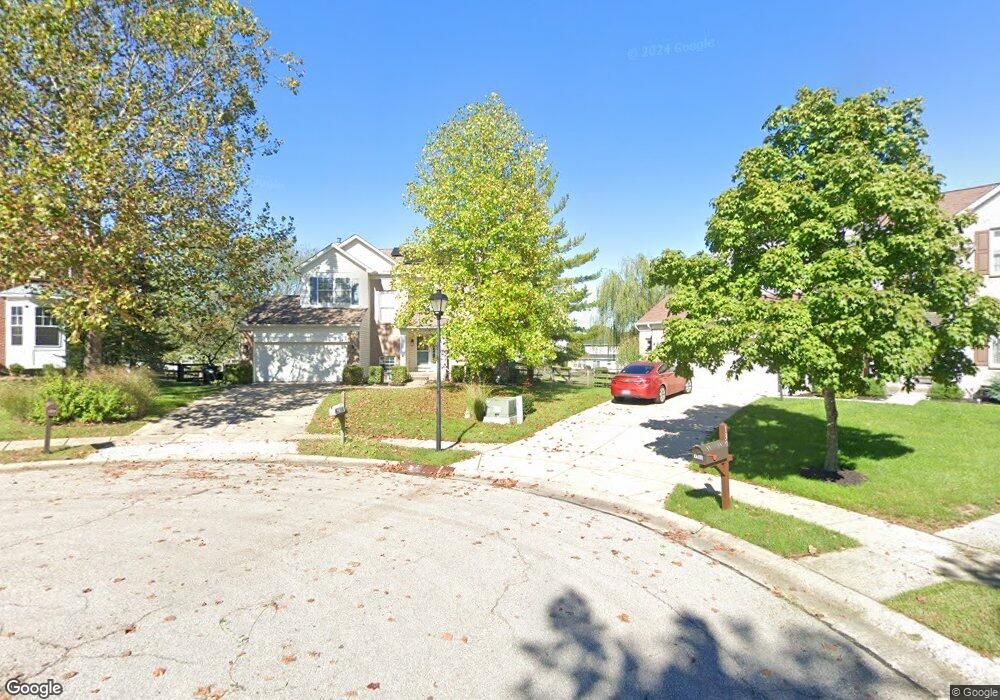
This home is located at 1303 Wilshire Ct, Union, KY 41091 and is currently estimated at $391,289, approximately $172 per square foot. 1303 Wilshire Ct is a home located in Boone County with nearby schools including Erpenbeck Elementary School, Ockerman Middle School, and Larry A. Ryle High School.
Ownership History
Date
Name
Owned For
Owner Type
Purchase Details
Closed on
Jul 26, 2025
Sold by
Gormally Sara Jane
Bought by
Gormally Joseph
Current Estimated Value
Purchase Details
Closed on
Oct 24, 2008
Sold by
Gormally Sara and Gormally Joseph
Bought by
Gormally Sara Jane and Gormally Joseph
Purchase Details
Closed on
Oct 4, 2005
Sold by
Funken Wolfgang and Funken Ingrid
Bought by
Gormally Sara
Home Financials for this Owner
Home Financials are based on the most recent Mortgage that was taken out on this home.
Original Mortgage
$196,800
Interest Rate
8.4%
Mortgage Type
Adjustable Rate Mortgage/ARM
Purchase Details
Closed on
Aug 23, 2000
Sold by
Ryland Group Inc
Bought by
Funken Wolfgang and Funken Ingrid
Home Financials for this Owner
Home Financials are based on the most recent Mortgage that was taken out on this home.
Original Mortgage
$100,000
Interest Rate
8.07%
Mortgage Type
New Conventional
Purchase Details
Closed on
Apr 13, 2000
Sold by
A & K Enterprise Inc
Bought by
Ryland Group Inc
Create a Home Valuation Report for This Property
The Home Valuation Report is an in-depth analysis detailing your home's value as well as a comparison with similar homes in the area
Home Values in the Area
Average Home Value in this Area
Purchase History
| Date | Buyer | Sale Price | Title Company |
|---|---|---|---|
| Gormally Joseph | -- | None Listed On Document | |
| Gormally Sara Jane | -- | Chicago Title Insurance Comp | |
| Gormally Sara | $246,000 | None Available | |
| Funken Wolfgang | $206,895 | -- | |
| Ryland Group Inc | $27,210 | -- |
Source: Public Records
Mortgage History
| Date | Status | Borrower | Loan Amount |
|---|---|---|---|
| Previous Owner | Gormally Sara | $196,800 | |
| Previous Owner | Funken Wolfgang | $100,000 |
Source: Public Records
Tax History Compared to Growth
Tax History
| Year | Tax Paid | Tax Assessment Tax Assessment Total Assessment is a certain percentage of the fair market value that is determined by local assessors to be the total taxable value of land and additions on the property. | Land | Improvement |
|---|---|---|---|---|
| 2024 | $2,678 | $237,000 | $30,000 | $207,000 |
| 2023 | $2,772 | $237,000 | $30,000 | $207,000 |
| 2022 | $2,661 | $237,000 | $30,000 | $207,000 |
| 2021 | $2,741 | $237,000 | $30,000 | $207,000 |
| 2020 | $2,713 | $237,000 | $30,000 | $207,000 |
| 2019 | $2,570 | $221,910 | $30,000 | $191,910 |
| 2018 | $2,607 | $221,910 | $30,000 | $191,910 |
| 2017 | $2,532 | $221,910 | $30,000 | $191,910 |
| 2015 | $2,501 | $221,910 | $30,000 | $191,910 |
| 2013 | -- | $246,000 | $30,000 | $216,000 |
Source: Public Records
Map
Nearby Homes
- 9807 Cherbourg Dr
- 3832 Sonata Dr
- 1305 Rubyhill Ln
- 1337 Retriever Way
- 9154 Armistead Ct
- 1802 Mimosa Trail
- 2029 Stonewall Trail
- 1974 Prosperity Ct
- 2030 Stonewall Trail
- 8540 Concerto Ct
- 8558 Concerto Ct Unit 251C
- 8554 Concerto Ct Unit 251B
- 8550 Concerto Ct Unit 251A
- 8566 Concerto Ct
- 8554 Concerto Ct
- 8558 Concerto Ct
- 8570 Concerto Ct
- 8550 Concerto Ct
- 8520 Concerto Ct
- 8524 Concerto Ct
- 1300 Wilshire Ct
- 9817 Cherbourg Dr
- 1307 Wilshire Ct
- 9819 Cherbourg Dr
- 1259 Lancashire Dr
- 9815 Cherbourg Dr
- 9815 Cherbourg Dr Unit 152
- 1306 Wilshire Ct
- 1263 Lancashire Dr
- 1311 Wilshire Ct
- 1267 Lancashire Dr
- 9811 Cherbourg Dr
- 9811 Cherbourg Dr Unit 151
- 1310 Wilshire Ct
- 149 Cherbourg Dr
- 9823 Cherbourg Dr
- 1315 Wilshire Ct
- 9807 Cherbourg Dr Unit 140
- 1271 Lancashire Dr
- 1314 Wilshire Ct