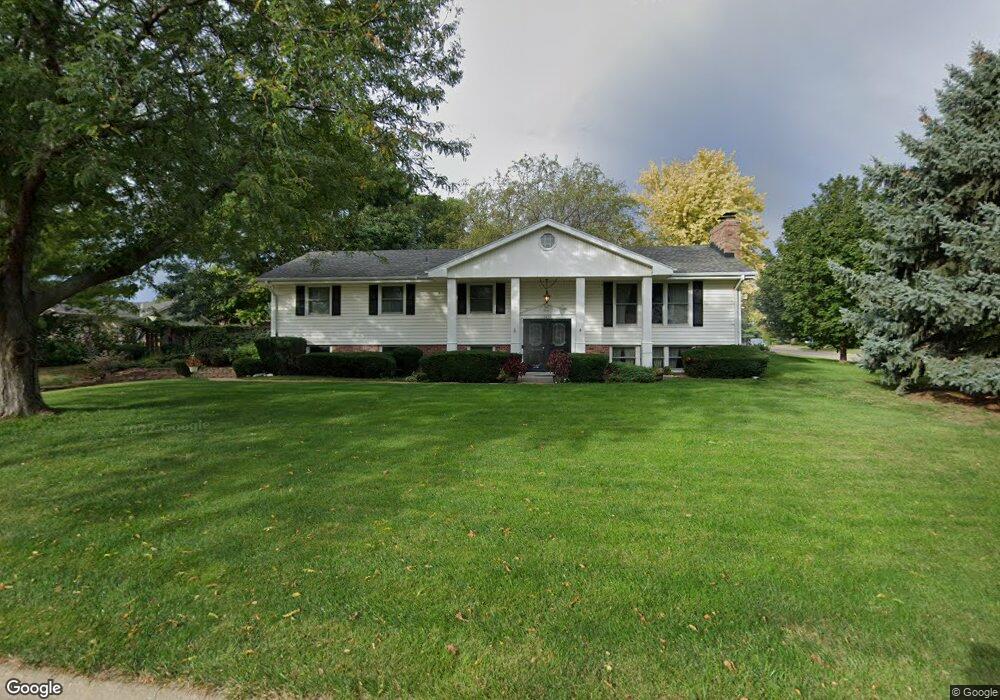
13031 Old Cherry Cir Omaha, NE 68137
Millard Highlands NeighborhoodEstimated Value: $307,001 - $332,000
4
Beds
5
Baths
2,135
Sq Ft
$152/Sq Ft
Est. Value
About This Home
This home is located at 13031 Old Cherry Cir, Omaha, NE 68137 and is currently estimated at $323,750, approximately $151 per square foot. 13031 Old Cherry Cir is a home located in Douglas County with nearby schools including Sandoz Elementary School, Millard South High School, and Millard Central Middle School.
Ownership History
Date
Name
Owned For
Owner Type
Purchase Details
Closed on
Nov 21, 2024
Sold by
Adams Melvin A and Adams Diane R
Bought by
Melvin And Diane Adams Living Trust and Adams
Current Estimated Value
Purchase Details
Closed on
Jun 7, 2003
Sold by
Bludworth John and Bludworth Judith
Bought by
Adams Melvin A and Johnson Diane Reye
Home Financials for this Owner
Home Financials are based on the most recent Mortgage that was taken out on this home.
Original Mortgage
$128,000
Interest Rate
5.44%
Mortgage Type
Purchase Money Mortgage
Purchase Details
Closed on
Jul 2, 2001
Sold by
Villani Arthur L and Villani Nancy J
Bought by
Bludworth John and Bludworth Judith
Home Financials for this Owner
Home Financials are based on the most recent Mortgage that was taken out on this home.
Original Mortgage
$138,700
Interest Rate
6.96%
Create a Home Valuation Report for This Property
The Home Valuation Report is an in-depth analysis detailing your home's value as well as a comparison with similar homes in the area
Home Values in the Area
Average Home Value in this Area
Purchase History
| Date | Buyer | Sale Price | Title Company |
|---|---|---|---|
| Melvin And Diane Adams Living Trust | -- | None Listed On Document | |
| Adams Melvin A | $160,000 | -- | |
| Bludworth John | $146,000 | -- |
Source: Public Records
Mortgage History
| Date | Status | Borrower | Loan Amount |
|---|---|---|---|
| Previous Owner | Adams Melvin A | $128,000 | |
| Previous Owner | Bludworth John | $138,700 |
Source: Public Records
Tax History Compared to Growth
Tax History
| Year | Tax Paid | Tax Assessment Tax Assessment Total Assessment is a certain percentage of the fair market value that is determined by local assessors to be the total taxable value of land and additions on the property. | Land | Improvement |
|---|---|---|---|---|
| 2025 | $4,239 | $257,400 | $29,500 | $227,900 |
| 2024 | $5,125 | $257,400 | $29,500 | $227,900 |
| 2023 | $5,125 | $257,400 | $29,500 | $227,900 |
| 2022 | $4,472 | $211,600 | $29,500 | $182,100 |
| 2021 | $4,449 | $211,600 | $29,500 | $182,100 |
| 2020 | $3,874 | $182,700 | $29,500 | $153,200 |
| 2019 | $3,885 | $182,700 | $29,500 | $153,200 |
| 2018 | $3,728 | $172,900 | $29,500 | $143,400 |
| 2017 | $3,566 | $168,000 | $29,500 | $138,500 |
| 2016 | $3,244 | $152,700 | $21,100 | $131,600 |
| 2015 | $3,095 | $142,700 | $19,700 | $123,000 |
| 2014 | $3,095 | $142,700 | $19,700 | $123,000 |
Source: Public Records
Map
Nearby Homes
- 13116 Southdale Cir
- 21445 Morning View Dr
- 21404 Morning View Dr
- 21446 Morning View Dr
- 6625 S 129th St
- 12830 Emiline St
- 12826 Emiline St
- 7009 S 129th St
- 12805 Southdale Dr
- 13326 Adams St
- 12814 Sky Park Dr
- 6729 S 135th Ave
- 13518 Washington Cir
- 13415 Josephine St
- 13433 Edna St
- 13418 Olive St
- 13702 Birchwood Ave
- 12609 Lillian St
- 13569 Berry Cir
- 7520 S 135th St
- 6605 Winslow Place
- 13027 Old Cherry Cir
- 13011 Old Cherry Cir
- 13015 Old Cherry Cir
- 6615 Winslow Place
- 13030 Old Cherry Rd
- 13023 Old Cherry Cir
- 13020 Old Cherry Rd
- 13023 Old Cherry Cir
- 6705 Winslow Place
- 13019 Old Cherry Cir
- 13005 Old Cherry Rd
- 6606 Winslow Place
- 6515 Winslow Place
- 6616 Winslow Place
- 6706 S 129th St
- 13106 Old Cherry Rd
- 13006 Southdale Dr
- 13016 Southdale Dr
- 6640 S 129th St