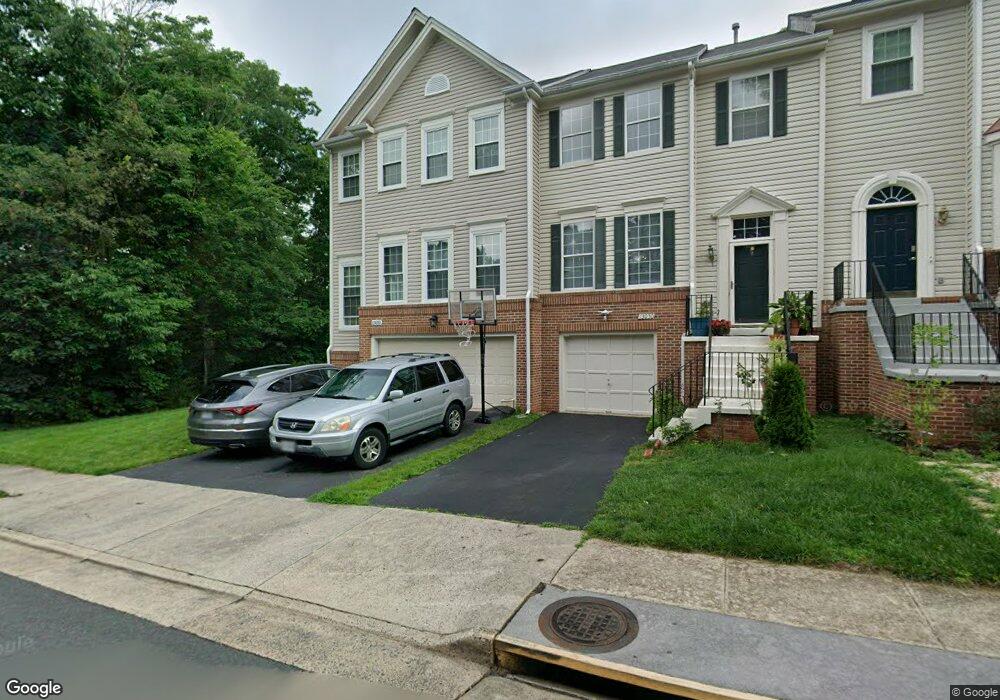
13032 Quartz Ln Clifton, VA 20124
Estimated Value: $711,000 - $724,000
3
Beds
4
Baths
1,908
Sq Ft
$376/Sq Ft
Est. Value
About This Home
This home is located at 13032 Quartz Ln, Clifton, VA 20124 and is currently estimated at $717,607, approximately $376 per square foot. 13032 Quartz Ln is a home located in Fairfax County with nearby schools including Willow Springs Elementary School, Fairfax High, and Little Flock Christian School.
Ownership History
Date
Name
Owned For
Owner Type
Purchase Details
Closed on
Oct 22, 2007
Sold by
Audrey Q Mccann Tr
Bought by
Purifoy Frankie L and Mcdaniel,Marcus L
Current Estimated Value
Home Financials for this Owner
Home Financials are based on the most recent Mortgage that was taken out on this home.
Original Mortgage
$436,905
Outstanding Balance
$277,028
Interest Rate
6.51%
Mortgage Type
New Conventional
Estimated Equity
$440,579
Purchase Details
Closed on
Apr 25, 2000
Sold by
Walker James C
Bought by
Mccann Audrey Q
Home Financials for this Owner
Home Financials are based on the most recent Mortgage that was taken out on this home.
Original Mortgage
$189,600
Interest Rate
8.23%
Purchase Details
Closed on
May 1, 1998
Sold by
Moore Richard J and Moore Peggy L
Bought by
Walker James C and Walker Denise A
Home Financials for this Owner
Home Financials are based on the most recent Mortgage that was taken out on this home.
Original Mortgage
$202,492
Interest Rate
7.04%
Mortgage Type
VA
Create a Home Valuation Report for This Property
The Home Valuation Report is an in-depth analysis detailing your home's value as well as a comparison with similar homes in the area
Home Values in the Area
Average Home Value in this Area
Purchase History
| Date | Buyer | Sale Price | Title Company |
|---|---|---|---|
| Purifoy Frankie L | $459,900 | -- | |
| Mccann Audrey Q | $237,000 | -- | |
| Walker James C | $210,000 | -- |
Source: Public Records
Mortgage History
| Date | Status | Borrower | Loan Amount |
|---|---|---|---|
| Open | Purifoy Frankie L | $436,905 | |
| Previous Owner | Mccann Audrey Q | $189,600 | |
| Previous Owner | Walker James C | $202,492 |
Source: Public Records
Tax History Compared to Growth
Tax History
| Year | Tax Paid | Tax Assessment Tax Assessment Total Assessment is a certain percentage of the fair market value that is determined by local assessors to be the total taxable value of land and additions on the property. | Land | Improvement |
|---|---|---|---|---|
| 2025 | $7,224 | $678,010 | $200,000 | $478,010 |
| 2024 | $7,224 | $623,590 | $180,000 | $443,590 |
| 2023 | $6,518 | $577,540 | $165,000 | $412,540 |
| 2022 | $6,534 | $571,420 | $165,000 | $406,420 |
| 2021 | $6,153 | $524,360 | $155,000 | $369,360 |
| 2020 | $6,102 | $515,600 | $155,000 | $360,600 |
| 2019 | $5,619 | $474,750 | $135,000 | $339,750 |
| 2018 | $5,230 | $454,760 | $130,000 | $324,760 |
| 2017 | $5,120 | $441,000 | $125,000 | $316,000 |
| 2016 | $5,222 | $450,770 | $125,000 | $325,770 |
| 2015 | $4,876 | $436,920 | $120,000 | $316,920 |
| 2014 | $4,865 | $436,920 | $120,000 | $316,920 |
Source: Public Records
Map
Nearby Homes
- 12977 Hampton Forest Ct
- 5680 White Dove Ln
- 12882 Crouch Dr
- 5716 Osprey Ct
- 5724 Harrier Dr
- 5842 Orchard Hill Ct
- 5816 Orchard Hill Ln
- 12609 Braddock Rd
- 5809 Waterdale Ct
- 5459 Serviceberry St
- 5280 Jule Star Dr
- 6117 Mountain Springs Ln
- 5653 Faircloth Ct
- 5096 Village Fountain Place
- 5209 Jule Star Dr
- 13633 Union Village Cir
- 5019 Village Fountain Place
- 13644 Shreve St
- 5936 Spruce Run Ct
- 5126 Brittney Elyse Cir Unit A
- 13030 Quartz Ln
- 13028 Quartz Ln
- 13026 Quartz Ln
- 13034 Quartz Ln
- 13024 Quartz Ln
- 13036 Quartz Ln
- 13022 Quartz Ln
- 13038 Quartz Ln
- 13020 Quartz Ln
- 13040 Quartz Ln
- 13042 Quartz Ln
- 13018 Quartz Ln
- 13016 Quartz Ln
- 13014 Quartz Ln
- 13044 Quartz Ln
- 13046 Quartz Ln
- 13048 Quartz Ln
- 13042 Cobble Ln
- 13050 Quartz Ln
- 13012 Quartz Ln