Estimated Value: $857,000 - $975,000
3
Beds
2
Baths
1,284
Sq Ft
$714/Sq Ft
Est. Value
About This Home
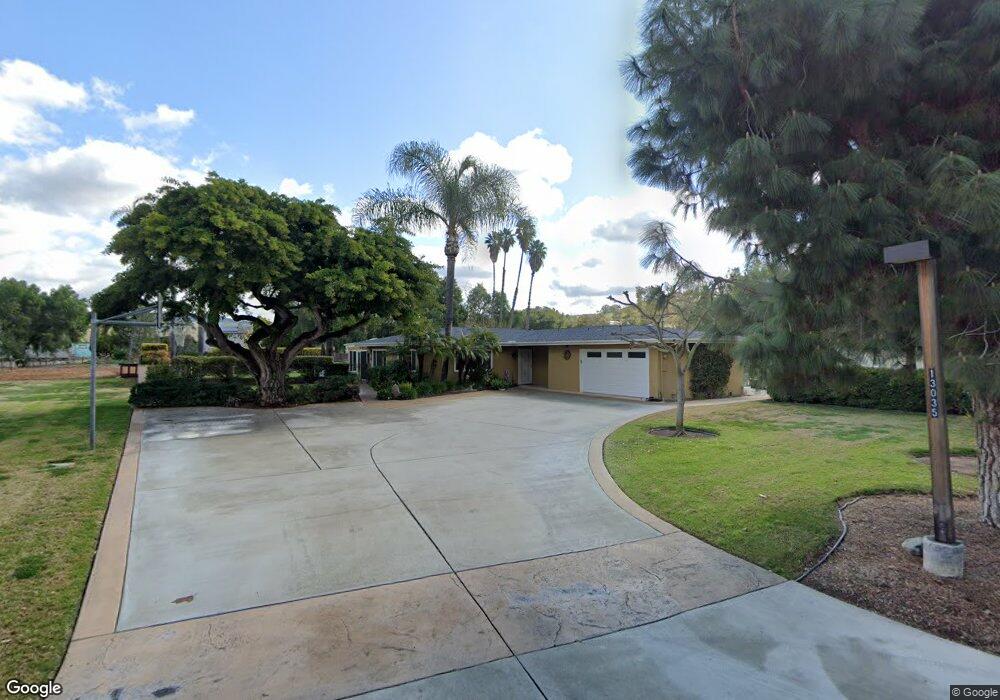
This home is located at 13035 Sudan Rd, Poway, CA 92064 and is currently estimated at $917,305, approximately $714 per square foot. 13035 Sudan Rd is a home located in San Diego County with nearby schools including Garden Road Elementary, Twin Peaks Middle, and Poway High.
Ownership History
Date
Name
Owned For
Owner Type
Purchase Details
Closed on
May 11, 2017
Sold by
Mcclung Martin and Mcclung Lisa
Bought by
Mcclung Martin and Mcclung Lisa J
Current Estimated Value
Purchase Details
Closed on
Jan 22, 2007
Sold by
Mcclung Martin
Bought by
Mcclung Martin and Mcclung Lisa
Home Financials for this Owner
Home Financials are based on the most recent Mortgage that was taken out on this home.
Original Mortgage
$295,000
Outstanding Balance
$175,308
Interest Rate
6.11%
Mortgage Type
Stand Alone Refi Refinance Of Original Loan
Estimated Equity
$741,997
Purchase Details
Closed on
Aug 4, 1998
Sold by
Mcclung Jack R and Mcclung Frances M
Bought by
Mcclung Marty and Mcclung Lisa
Home Financials for this Owner
Home Financials are based on the most recent Mortgage that was taken out on this home.
Original Mortgage
$152,000
Interest Rate
6.92%
Create a Home Valuation Report for This Property
The Home Valuation Report is an in-depth analysis detailing your home's value as well as a comparison with similar homes in the area
Home Values in the Area
Average Home Value in this Area
Purchase History
| Date | Buyer | Sale Price | Title Company |
|---|---|---|---|
| Mcclung Martin | -- | None Available | |
| Mcclung Martin | -- | Chicago Title Co | |
| Mcclung Marty | $190,000 | Commonwealth Land Title Co |
Source: Public Records
Mortgage History
| Date | Status | Borrower | Loan Amount |
|---|---|---|---|
| Open | Mcclung Martin | $295,000 | |
| Previous Owner | Mcclung Marty | $152,000 |
Source: Public Records
Tax History
| Year | Tax Paid | Tax Assessment Tax Assessment Total Assessment is a certain percentage of the fair market value that is determined by local assessors to be the total taxable value of land and additions on the property. | Land | Improvement |
|---|---|---|---|---|
| 2025 | $3,295 | $297,840 | $203,791 | $94,049 |
| 2024 | $3,295 | $292,001 | $199,796 | $92,205 |
| 2023 | $3,224 | $286,277 | $195,879 | $90,398 |
| 2022 | $3,170 | $280,665 | $192,039 | $88,626 |
| 2021 | $3,128 | $275,163 | $188,274 | $86,889 |
| 2020 | $3,086 | $272,343 | $186,344 | $85,999 |
| 2019 | $3,007 | $267,004 | $182,691 | $84,313 |
| 2018 | $2,922 | $261,769 | $179,109 | $82,660 |
| 2017 | $172 | $256,638 | $175,598 | $81,040 |
| 2016 | $2,785 | $251,606 | $172,155 | $79,451 |
| 2015 | $2,744 | $247,828 | $169,570 | $78,258 |
| 2014 | $2,680 | $242,975 | $166,249 | $76,726 |
Source: Public Records
Map
Nearby Homes
- 13746 Paseo Bonita
- 13419 Sebago Ave
- 14118 Ipava Dr
- 000 Carlson Ct 9 Unit 9
- 14610 Fairburn St
- 13716 Midland Rd
- 13329 Casa Vista St Unit 98
- 14003 Jasmine Ave Unit 193
- 14089 Pomegranate Ave Unit 214
- 13908 Hibiscus Ave Unit 40
- 13941 Wisteria Ave
- 13850 Midgrove Ct
- 12959 Creek Park Dr
- 13947 Midland Rd
- 13220 Dana Vista St Unit 114
- 13619 Sycamore Tree Ln
- 13230 Creekside Ln
- 13314 Buena Vista Unit 71
- 13111 Bonita Vista St Unit 228
- 12824 Granada Dr Unit 322
- 13101 Sudan Rd
- 13060 Welton Ln
- 13979 Chancellor Way
- 323-270-57 Welton Ln
- 13107 Sudan Rd
- 13017 Welton Ln
- 13047 Welton Ln
- 13012 Welton Ln
- 13980 Chancellor Way
- 13967 Chancellor Way
- 13110 Welton Ln
- 13113 Sudan Rd
- 13101 Welton Ln
- 13968 Chancellor Way
- 13019 Welton Ln
- 13116 Welton Ln
- 13951 Chancellor Way
- 13121 Sudan Rd
- 13115 Welton Ln
- 12990 Meadow Creek Ln
Your Personal Tour Guide
Ask me questions while you tour the home.