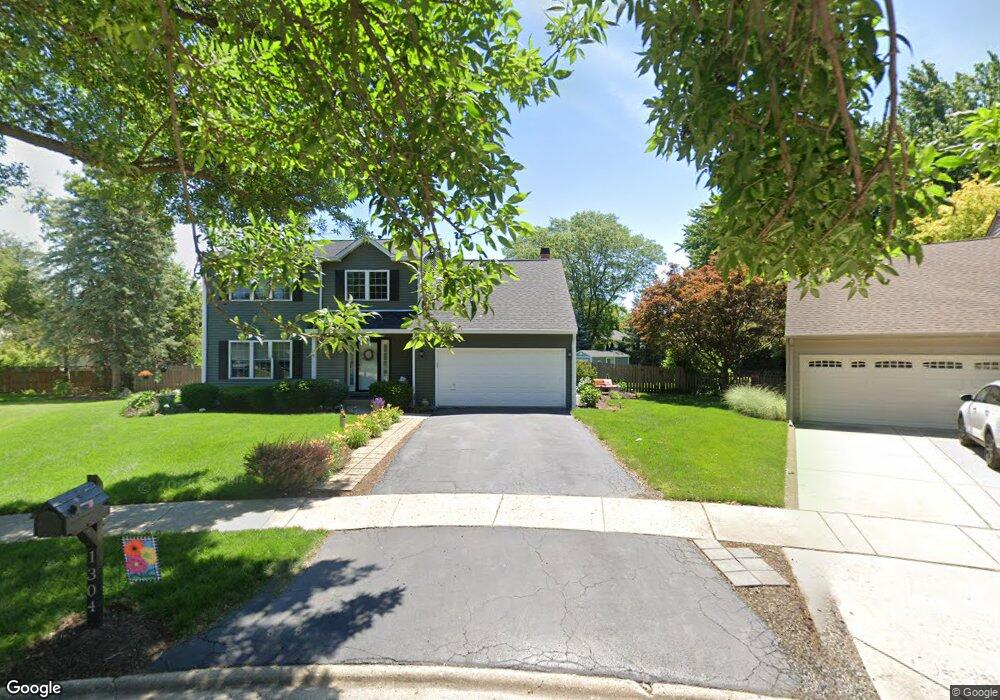
1304 Fireside Ct Naperville, IL 60564
Brook Crossing NeighborhoodEstimated Value: $492,754 - $537,000
4
Beds
3
Baths
2,218
Sq Ft
$233/Sq Ft
Est. Value
About This Home
This home is located at 1304 Fireside Ct, Naperville, IL 60564 and is currently estimated at $516,939, approximately $233 per square foot. 1304 Fireside Ct is a home located in Will County with nearby schools including Robert Clow Elementary School, Gordon Gregory Middle School, and Neuqua Valley High School.
Ownership History
Date
Name
Owned For
Owner Type
Purchase Details
Closed on
Apr 28, 2006
Sold by
Hoth John L and Hoth Maureen P
Bought by
Giglio Frank and Giglio Michele
Current Estimated Value
Home Financials for this Owner
Home Financials are based on the most recent Mortgage that was taken out on this home.
Original Mortgage
$258,000
Outstanding Balance
$150,616
Interest Rate
6.54%
Mortgage Type
Fannie Mae Freddie Mac
Estimated Equity
$366,323
Purchase Details
Closed on
Dec 27, 1996
Sold by
Hoth Maureen P
Bought by
Hoth Maureen P and Hoth John L
Home Financials for this Owner
Home Financials are based on the most recent Mortgage that was taken out on this home.
Original Mortgage
$100,000
Interest Rate
7.6%
Purchase Details
Closed on
Feb 22, 1996
Sold by
Bank One Chicago Na
Bought by
Hoth Maureen P
Create a Home Valuation Report for This Property
The Home Valuation Report is an in-depth analysis detailing your home's value as well as a comparison with similar homes in the area
Home Values in the Area
Average Home Value in this Area
Purchase History
We collect this data history from publicly available records. To have your information removed, we recommend requesting removal directly through your county’s website.
| Date | Buyer | Sale Price | Title Company |
|---|---|---|---|
| Giglio Frank | $322,500 | Multiple | |
| Hoth Maureen P | -- | -- | |
| Hoth Maureen P | -- | -- |
Source: Public Records
Mortgage History
We collect this data history from publicly available records. To have your information removed, we recommend requesting removal directly through your county’s website.
| Date | Status | Borrower | Loan Amount |
|---|---|---|---|
| Open | Giglio Frank | $258,000 | |
| Previous Owner | Hoth Maureen P | $100,000 |
Source: Public Records
Tax History
| Year | Tax Paid | Tax Assessment Tax Assessment Total Assessment is a certain percentage of the fair market value that is determined by local assessors to be the total taxable value of land and additions on the property. | Land | Improvement |
|---|---|---|---|---|
| 2024 | $10,186 | $155,873 | $40,333 | $115,540 |
| 2023 | $9,686 | $137,697 | $35,630 | $102,067 |
| 2022 | $9,003 | $130,259 | $33,706 | $96,553 |
| 2021 | $8,599 | $124,056 | $32,101 | $91,955 |
| 2020 | $8,434 | $122,090 | $31,592 | $90,498 |
| 2019 | $8,286 | $118,650 | $30,702 | $87,948 |
| 2018 | $8,036 | $113,271 | $30,026 | $83,245 |
| 2017 | $7,910 | $110,347 | $29,251 | $81,096 |
| 2016 | $7,892 | $107,971 | $28,621 | $79,350 |
| 2015 | $6,738 | $103,818 | $27,520 | $76,298 |
| 2014 | $6,738 | $87,910 | $27,520 | $60,390 |
| 2013 | $6,738 | $87,910 | $27,520 | $60,390 |
Source: Public Records
Map
Nearby Homes
- 1227 Windemere Ave
- 1239 Thackery Ct
- 2576 Leach Dr
- 1260 Cromwell Ln
- 2418 Flambeau Dr
- 28W502 Leverenz Rd
- 2404 Flambeau Dr
- 28W516 Leverenz Rd
- 28W555 Leverenz Rd
- 3111 Landore Dr
- 1329 Neskola Ct
- 10S287 Alma Ln
- 1860 Tamahawk Ln
- 10S220 Alan Rd Unit 2
- 28W660 Perkins Ct
- 1244 Hollingswood Ave
- 2624 Wendy Dr
- 2209 Mecan Dr
- 908 Winners Cup Ct
- 3328 Timber Creek Ln Unit 3
- 2701 Midland Dr
- 2705 Midland Dr
- 2633 Midland Dr
- 1308 Fireside Ct
- 1301 Windemere Ave
- 2629 Midland Dr
- 1305 Fireside Ct
- 1305 Windemere Ave
- 2700 Midland Dr
- 2632 Midland Dr
- 1309 Windemere Ave
- 2625 Midland Dr
- 1309 Fireside Ct
- 2628 Midland Dr
- 1275 Windemere Ave
- 1312 Fireside Ct
- 1313 Windemere Ave
- 1275 Brook Crossing Ct
- 2624 Midland Dr
- 1300 Windemere Ave
Your Personal Tour Guide
Ask me questions while you tour the home.