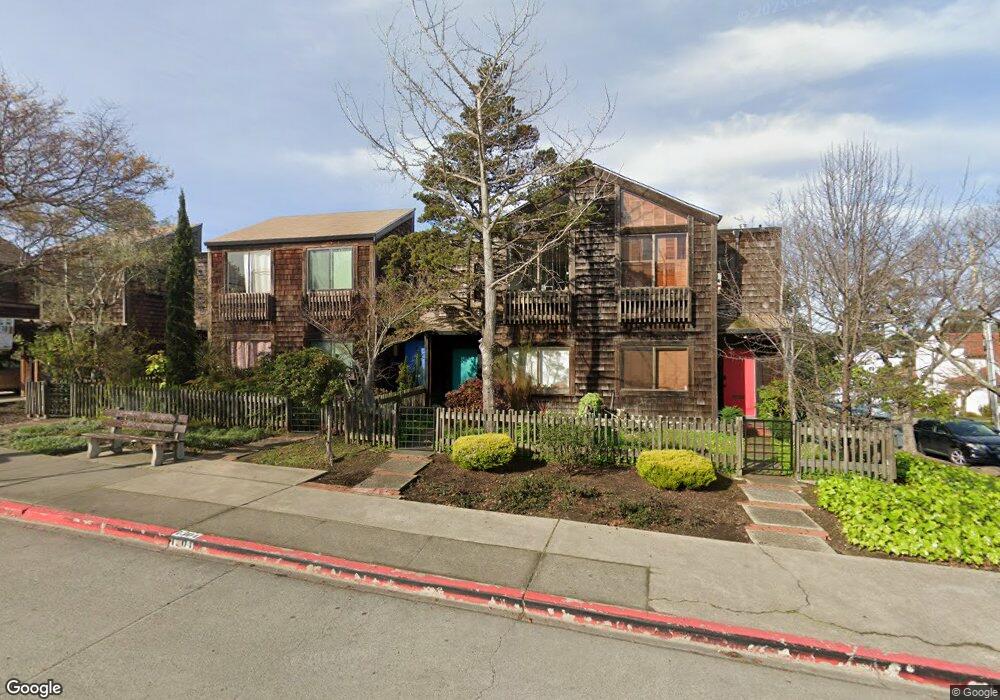
1304 Henry St Berkeley, CA 94709
North Berkeley NeighborhoodEstimated Value: $980,455 - $1,198,000
2
Beds
2
Baths
1,174
Sq Ft
$939/Sq Ft
Est. Value
About This Home
This home is located at 1304 Henry St, Berkeley, CA 94709 and is currently estimated at $1,101,864, approximately $938 per square foot. 1304 Henry St is a home located in Alameda County with nearby schools including Berkeley Arts Magnet at Whittier School, Cragmont Elementary School, and Washington Elementary School.
Ownership History
Date
Name
Owned For
Owner Type
Purchase Details
Closed on
Oct 28, 2019
Sold by
Policoff Stephen P and Policoff Lea
Bought by
Jablonski Christopher and Cohen Caroline Natalie
Current Estimated Value
Home Financials for this Owner
Home Financials are based on the most recent Mortgage that was taken out on this home.
Original Mortgage
$668,000
Outstanding Balance
$588,252
Interest Rate
3.65%
Mortgage Type
New Conventional
Estimated Equity
$513,612
Purchase Details
Closed on
Aug 14, 1997
Sold by
Policoff Leonard and Policoff Naomi L
Bought by
Policoff Leonard David and Policoff Naomi Lewis
Purchase Details
Closed on
Oct 17, 1995
Sold by
Alvord Robert W and Critchfield Richard Patrick
Bought by
Policoff Leonard and Policoff Naomi L
Home Financials for this Owner
Home Financials are based on the most recent Mortgage that was taken out on this home.
Original Mortgage
$50,000
Interest Rate
7.59%
Mortgage Type
Purchase Money Mortgage
Create a Home Valuation Report for This Property
The Home Valuation Report is an in-depth analysis detailing your home's value as well as a comparison with similar homes in the area
Home Values in the Area
Average Home Value in this Area
Purchase History
| Date | Buyer | Sale Price | Title Company |
|---|---|---|---|
| Jablonski Christopher | $835,000 | Old Republic Title Company | |
| Policoff Leonard David | -- | -- | |
| Policoff Leonard | $240,000 | Placer Title Company |
Source: Public Records
Mortgage History
| Date | Status | Borrower | Loan Amount |
|---|---|---|---|
| Open | Jablonski Christopher | $668,000 | |
| Previous Owner | Policoff Leonard | $50,000 |
Source: Public Records
Tax History
| Year | Tax Paid | Tax Assessment Tax Assessment Total Assessment is a certain percentage of the fair market value that is determined by local assessors to be the total taxable value of land and additions on the property. | Land | Improvement |
|---|---|---|---|---|
| 2025 | $13,218 | $913,180 | $229,662 | $683,518 |
| 2024 | $13,218 | $895,277 | $225,159 | $670,118 |
| 2023 | $12,954 | $877,726 | $220,745 | $656,981 |
| 2022 | $12,743 | $860,517 | $216,417 | $644,100 |
| 2021 | $12,786 | $843,650 | $212,175 | $631,475 |
| 2020 | $12,154 | $835,000 | $210,000 | $625,000 |
| 2019 | $5,897 | $347,310 | $103,050 | $244,260 |
| 2018 | $5,782 | $340,500 | $101,029 | $239,471 |
| 2017 | $5,565 | $333,826 | $99,049 | $234,777 |
| 2016 | $5,340 | $327,281 | $97,107 | $230,174 |
| 2015 | $5,262 | $322,366 | $95,649 | $226,717 |
| 2014 | $5,215 | $316,052 | $93,775 | $222,277 |
Source: Public Records
Map
Nearby Homes
- 2012 Rose St
- 1440 Walnut St Unit 5
- 1425 Martin Luther King jr Way
- 1444 Walnut St
- 1610 Milvia St
- 1609 Bonita Ave Unit 3
- 1609 Bonita Ave Unit 5
- 1471 Scenic Ave
- 2201 Virginia St Unit 2
- 2015 Delaware St
- 2015 Delaware St Unit A
- 2340 Virginia St
- 826 Indian Rock Ave
- 2451 Le Conte Ave
- 1136 Keith Ave
- 1106 Cragmont Ave
- 2600 Hilgard Ave
- 1564 Sacramento St
- 1360 Acton St
- 2634 Virginia St Unit 13
- 1308 Henry St Unit 3
- 2010 Berryman St
- 1328 Henry St
- 1332 Henry St Unit 9
- 1305 Milvia St
- 1301 Milvia St
- 1311 Milvia St
- 1307 Milvia St
- 1384 Henry St
- 1312 Henry St
- 1315 Milvia St
- 1300 Henry St Unit 1
- 1380 Henry St Unit 21
- 1356 Henry St Unit 15
- 1348 Henry St Unit 13
- 1340 Henry St
- 1336 Henry St
- 1320 Henry St
- 1316 Henry St Unit 5
- 2005 Berryman St
Your Personal Tour Guide
Ask me questions while you tour the home.