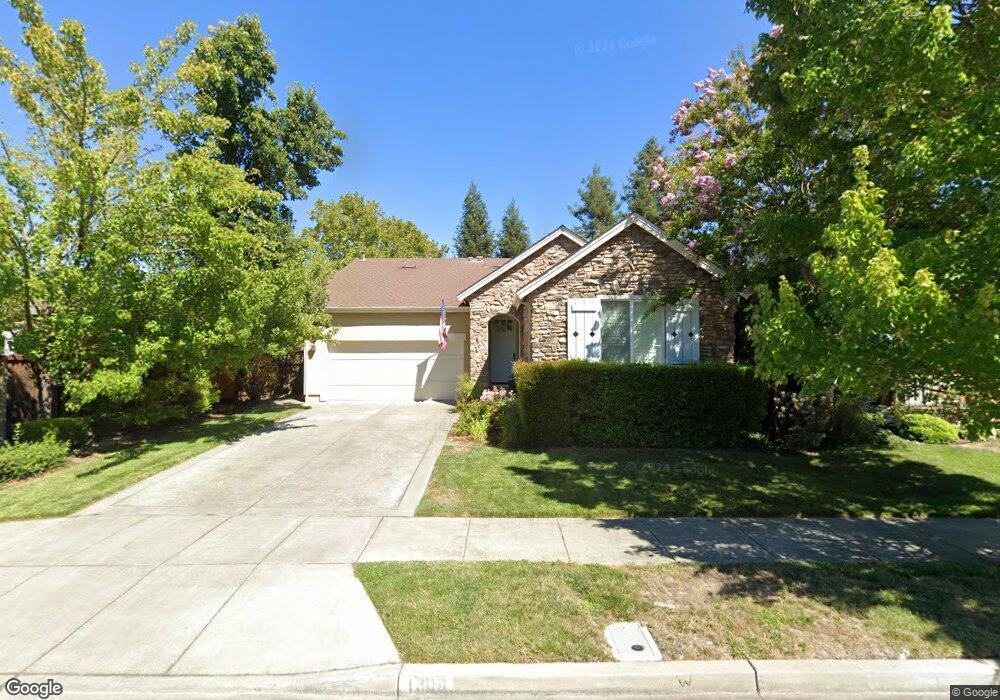
1304 Jones St Sonoma, CA 95476
Estimated Value: $1,179,389 - $1,445,000
3
Beds
2
Baths
1,669
Sq Ft
$802/Sq Ft
Est. Value
About This Home
This home is located at 1304 Jones St, Sonoma, CA 95476 and is currently estimated at $1,338,597, approximately $802 per square foot. 1304 Jones St is a home located in Sonoma County with nearby schools including Prestwood Elementary School, Adele Harrison Middle School, and Creekside High School.
Ownership History
Date
Name
Owned For
Owner Type
Purchase Details
Closed on
Jan 26, 2006
Sold by
Lounibos Hae Sook and Lounibos Robert G
Bought by
Lounibos Michael T and Lounibos Maria J
Current Estimated Value
Purchase Details
Closed on
Sep 21, 2005
Sold by
Harvest Lane Lp
Bought by
Lounibos Robert G and Lounibos Hae Sook
Home Financials for this Owner
Home Financials are based on the most recent Mortgage that was taken out on this home.
Original Mortgage
$668,272
Interest Rate
1%
Mortgage Type
New Conventional
Create a Home Valuation Report for This Property
The Home Valuation Report is an in-depth analysis detailing your home's value as well as a comparison with similar homes in the area
Home Values in the Area
Average Home Value in this Area
Purchase History
| Date | Buyer | Sale Price | Title Company |
|---|---|---|---|
| Lounibos Michael T | -- | None Available | |
| Lounibos Robert G | $835,500 | North American Title Co |
Source: Public Records
Mortgage History
| Date | Status | Borrower | Loan Amount |
|---|---|---|---|
| Previous Owner | Lounibos Robert G | $668,272 |
Source: Public Records
Tax History
| Year | Tax Paid | Tax Assessment Tax Assessment Total Assessment is a certain percentage of the fair market value that is determined by local assessors to be the total taxable value of land and additions on the property. | Land | Improvement |
|---|---|---|---|---|
| 2025 | $15,009 | $1,164,321 | $557,556 | $606,765 |
| 2024 | $15,009 | $1,141,492 | $546,624 | $594,868 |
| 2023 | $15,009 | $1,119,110 | $535,906 | $583,204 |
| 2022 | $13,709 | $1,097,168 | $525,399 | $571,769 |
| 2021 | $12,323 | $973,000 | $465,000 | $508,000 |
| 2020 | $12,477 | $973,000 | $465,000 | $508,000 |
| 2019 | $12,349 | $973,000 | $466,000 | $507,000 |
| 2018 | $12,757 | $962,000 | $461,000 | $501,000 |
| 2017 | $11,677 | $905,000 | $433,000 | $472,000 |
| 2016 | $11,241 | $887,000 | $425,000 | $462,000 |
| 2015 | $10,809 | $867,000 | $415,000 | $452,000 |
| 2014 | $8,588 | $651,000 | $312,000 | $339,000 |
Source: Public Records
Map
Nearby Homes
Your Personal Tour Guide
Ask me questions while you tour the home.