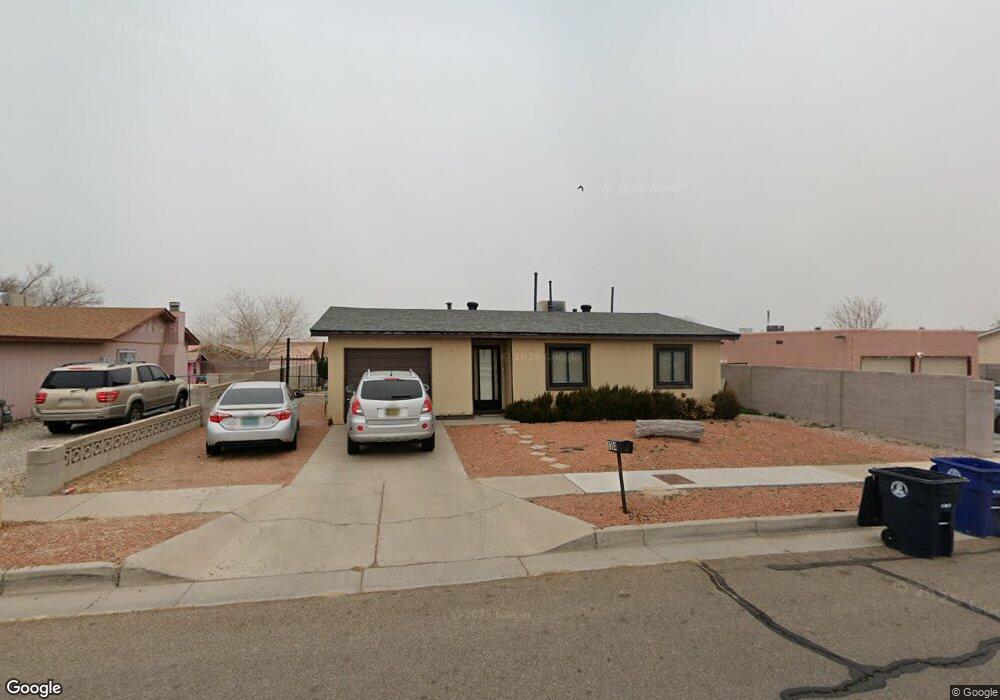
1304 Lucretia St SW Albuquerque, NM 87121
Southwest Heights NeighborhoodEstimated Value: $237,000 - $246,000
3
Beds
2
Baths
1,040
Sq Ft
$233/Sq Ft
Est. Value
About This Home
This home is located at 1304 Lucretia St SW, Albuquerque, NM 87121 and is currently estimated at $241,893, approximately $232 per square foot. 1304 Lucretia St SW is a home located in Bernalillo County with nearby schools including Maryann Binford Elementary School, Truman Middle School, and Atrisco Heritage Academy High School.
Ownership History
Date
Name
Owned For
Owner Type
Purchase Details
Closed on
Dec 21, 2007
Sold by
Allen Kenneth
Bought by
Meeks Felicia G
Current Estimated Value
Home Financials for this Owner
Home Financials are based on the most recent Mortgage that was taken out on this home.
Original Mortgage
$96,000
Outstanding Balance
$60,363
Interest Rate
6.26%
Mortgage Type
Purchase Money Mortgage
Estimated Equity
$181,530
Purchase Details
Closed on
Jun 1, 2004
Sold by
State Street Bank & Trust Co
Bought by
Allen Kenneth
Home Financials for this Owner
Home Financials are based on the most recent Mortgage that was taken out on this home.
Original Mortgage
$84,000
Interest Rate
8.35%
Mortgage Type
Purchase Money Mortgage
Purchase Details
Closed on
Sep 23, 1998
Sold by
Sanchez Lenore V and Prando Sand
Bought by
Sanchez Lenore and Rebuldela Sandra
Home Financials for this Owner
Home Financials are based on the most recent Mortgage that was taken out on this home.
Original Mortgage
$73,100
Interest Rate
6.92%
Create a Home Valuation Report for This Property
The Home Valuation Report is an in-depth analysis detailing your home's value as well as a comparison with similar homes in the area
Home Values in the Area
Average Home Value in this Area
Purchase History
| Date | Buyer | Sale Price | Title Company |
|---|---|---|---|
| Meeks Felicia G | -- | -- | |
| Allen Kenneth | -- | First American Title Ins Co | |
| Sanchez Lenore | -- | Fidelity National Title Ins |
Source: Public Records
Mortgage History
| Date | Status | Borrower | Loan Amount |
|---|---|---|---|
| Open | Meeks Felicia G | $96,000 | |
| Previous Owner | Allen Kenneth | $84,000 | |
| Previous Owner | Sanchez Lenore | $73,100 |
Source: Public Records
Tax History Compared to Growth
Tax History
| Year | Tax Paid | Tax Assessment Tax Assessment Total Assessment is a certain percentage of the fair market value that is determined by local assessors to be the total taxable value of land and additions on the property. | Land | Improvement |
|---|---|---|---|---|
| 2025 | $1,310 | $31,978 | $9,449 | $22,529 |
| 2024 | $1,310 | $31,047 | $9,174 | $21,873 |
| 2023 | $1,288 | $30,143 | $8,907 | $21,236 |
| 2022 | $1,245 | $29,266 | $8,648 | $20,618 |
| 2021 | $1,203 | $28,413 | $8,396 | $20,017 |
| 2020 | $1,183 | $27,586 | $8,152 | $19,434 |
| 2019 | $1,149 | $26,783 | $7,915 | $18,868 |
| 2018 | $1,108 | $26,783 | $7,915 | $18,868 |
| 2017 | $1,074 | $26,003 | $7,684 | $18,319 |
| 2016 | $1,043 | $24,512 | $7,244 | $17,268 |
| 2015 | $23,798 | $23,798 | $7,033 | $16,765 |
| 2014 | $1,019 | $23,998 | $7,033 | $16,965 |
| 2013 | -- | $23,998 | $7,033 | $16,965 |
Source: Public Records
Map
Nearby Homes
- 1420 Summerfield Place SW
- 8600 Kimela Ct SW
- 1209 Locura Rd SW
- 1815 Shadetree Dr SW
- 8709 Rhonda Ave SW
- 7814 Desert Canyon Place SW
- 921 Roma Dora Ln
- 9300 Jenny Ave SW
- 7901 Purple Fringe Rd SW
- 1615 Quiet Desert Dr SW
- 0 Sage Rd SW Unit 1085259
- 0 Nwq Unser and Sage SW Unit 1081546
- 7605 Windsong Place SW
- 0 Sage & 90th St SW Unit 1083191
- 9508 Sage Ranch Ct SW
- 9504 Sage Ranch Ct
- 7304 Autumn Sky Rd SW
- 9520 Sage Ranch Ct SW
- 9600 Sage Ranch Ct
- 9609 Sage Ranch Ct SW
- 1300 Lucretia St SW
- 1308 Lucretia St SW
- 1312 Lucretia St SW
- 1305 Corriz Dr SW
- 1309 Corriz Dr SW
- 1301 Corriz Dr SW
- 1305 Lucretia St SW
- 1309 Lucretia St SW
- 1316 Lucretia St SW
- 8401 Sapphire St SW
- 1315 Corriz Dr SW
- 8408 Sapphire St SW
- 1313 Lucretia St SW
- 8405 Sapphire St SW
- 8309 Sapphire St SW
- 1216 Scotty Ct SW
- 1319 Corriz Dr SW
- 1320 Lucretia St SW
- 8305 Sapphire St SW
- 1317 Lucretia St SW