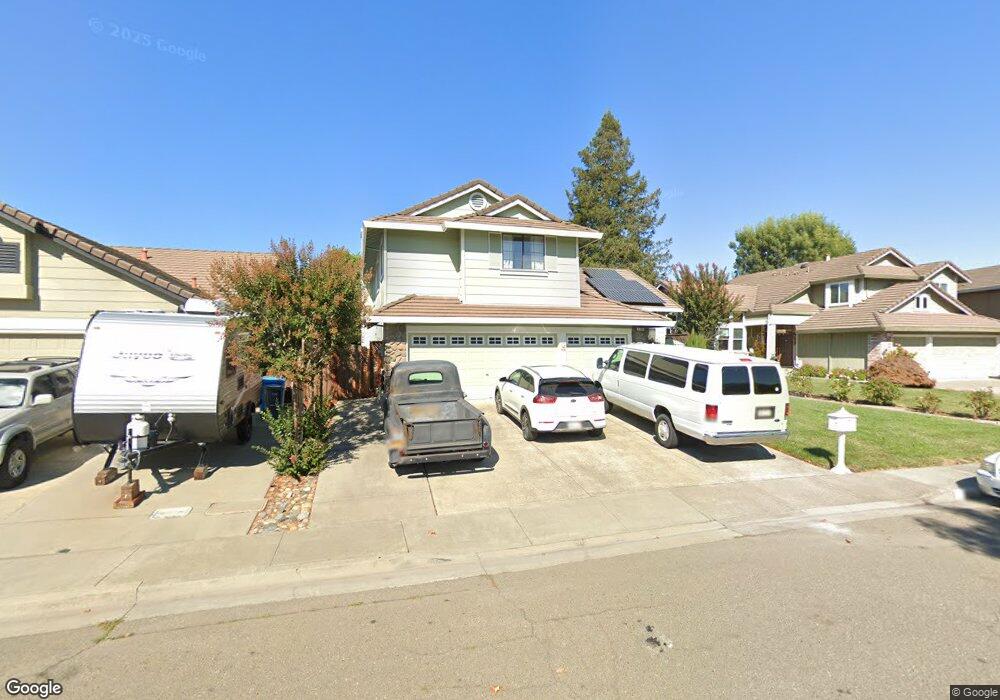
1304 Rosie Ct Rohnert Park, CA 94928
Estimated Value: $748,000 - $860,000
4
Beds
3
Baths
2,180
Sq Ft
$377/Sq Ft
Est. Value
About This Home
This home is located at 1304 Rosie Ct, Rohnert Park, CA 94928 and is currently estimated at $821,935, approximately $377 per square foot. 1304 Rosie Ct is a home located in Sonoma County with nearby schools including Rancho Cotate High School, Cross & Crown Lutheran School, and Bridghaven.
Ownership History
Date
Name
Owned For
Owner Type
Purchase Details
Closed on
Sep 6, 2005
Sold by
Raposo Lillian
Bought by
Raposo Roy J and Raposo Diane M
Current Estimated Value
Purchase Details
Closed on
Jan 12, 1999
Sold by
Kil Linda L and Kil John G
Bought by
Raposo Lillian
Home Financials for this Owner
Home Financials are based on the most recent Mortgage that was taken out on this home.
Original Mortgage
$195,000
Interest Rate
6.66%
Purchase Details
Closed on
Mar 6, 1995
Sold by
Lozano John G and Kill Linda L
Bought by
Lozano John G and Kil Linda L
Home Financials for this Owner
Home Financials are based on the most recent Mortgage that was taken out on this home.
Original Mortgage
$176,000
Interest Rate
9.21%
Purchase Details
Closed on
Feb 28, 1995
Sold by
Holcomb Joseph M
Bought by
Kil Linda S and Holcomb Linda S
Home Financials for this Owner
Home Financials are based on the most recent Mortgage that was taken out on this home.
Original Mortgage
$176,000
Interest Rate
9.21%
Create a Home Valuation Report for This Property
The Home Valuation Report is an in-depth analysis detailing your home's value as well as a comparison with similar homes in the area
Home Values in the Area
Average Home Value in this Area
Purchase History
| Date | Buyer | Sale Price | Title Company |
|---|---|---|---|
| Raposo Roy J | -- | -- | |
| Raposo Lillian | $285,000 | First American Title | |
| Lozano John G | -- | North American Title Company | |
| Kil Linda S | -- | North American Title Company |
Source: Public Records
Mortgage History
| Date | Status | Borrower | Loan Amount |
|---|---|---|---|
| Previous Owner | Raposo Lillian | $195,000 | |
| Previous Owner | Lozano John G | $176,000 |
Source: Public Records
Tax History Compared to Growth
Tax History
| Year | Tax Paid | Tax Assessment Tax Assessment Total Assessment is a certain percentage of the fair market value that is determined by local assessors to be the total taxable value of land and additions on the property. | Land | Improvement |
|---|---|---|---|---|
| 2025 | $5,041 | $446,791 | $133,250 | $313,541 |
| 2024 | $5,041 | $438,032 | $130,638 | $307,394 |
| 2023 | $5,041 | $429,444 | $128,077 | $301,367 |
| 2022 | $4,939 | $421,024 | $125,566 | $295,458 |
| 2021 | $4,898 | $412,769 | $123,104 | $289,665 |
| 2020 | $4,968 | $408,537 | $121,842 | $286,695 |
| 2019 | $4,902 | $400,527 | $119,453 | $281,074 |
| 2018 | $4,806 | $392,674 | $117,111 | $275,563 |
| 2017 | $4,724 | $384,975 | $114,815 | $270,160 |
| 2016 | $4,527 | $377,427 | $112,564 | $264,863 |
| 2015 | $4,415 | $371,759 | $110,874 | $260,885 |
| 2014 | $4,382 | $364,478 | $108,703 | $255,775 |
Source: Public Records
Map
Nearby Homes
- 7134 Carillon Ct
- 1347 Southwest Blvd Unit F
- 7103 Camino Colegio Unit 55
- 6731 Avenida Cala
- 6590 Joyce Ct
- 7645 Camino Colegio
- 7767 Camino Colegio Unit 29
- 8140 Sunflower Dr
- 1453 Oak Cir
- 5124 Kevin Place
- 5204 Kim Place
- 6469 Meadow Pines Ave
- 746 Bernadette Ave
- 5342 Kelliann Place
- 1501 Parkway Dr
- 1630 Kensington Place
- 1498 Parkway Dr
- 5429 Kaitlyn Place
- 1022 Civic Center Dr Unit 33
- 1482 Parkway Dr