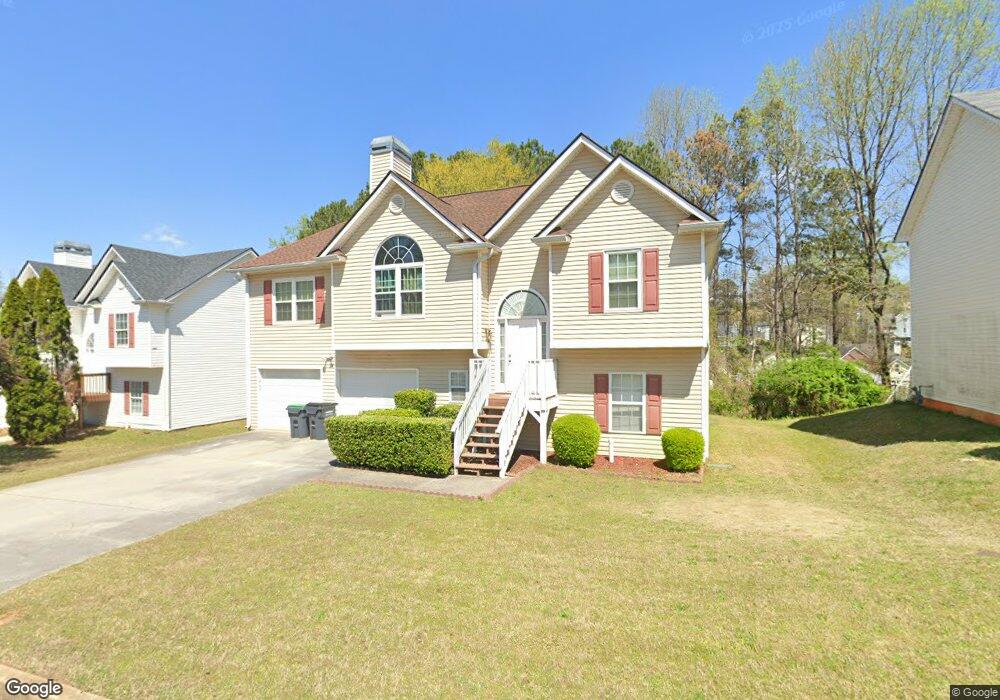
1304 Waymar Way SW Marietta, GA 30008
Southwestern Marietta NeighborhoodEstimated Value: $345,000 - $394,000
4
Beds
3
Baths
1,444
Sq Ft
$261/Sq Ft
Est. Value
About This Home
This home is located at 1304 Waymar Way SW, Marietta, GA 30008 and is currently estimated at $376,695, approximately $260 per square foot. 1304 Waymar Way SW is a home located in Cobb County with nearby schools including Milford Elementary School, Smitha Middle School, and Osborne High School.
Ownership History
Date
Name
Owned For
Owner Type
Purchase Details
Closed on
Feb 26, 2007
Sold by
Miller Rodney K
Bought by
Bailey Stephen
Current Estimated Value
Home Financials for this Owner
Home Financials are based on the most recent Mortgage that was taken out on this home.
Original Mortgage
$187,951
Outstanding Balance
$112,762
Interest Rate
6.19%
Mortgage Type
FHA
Estimated Equity
$263,933
Purchase Details
Closed on
Jul 25, 2003
Sold by
Glass Diana
Bought by
Miller Rodney K
Home Financials for this Owner
Home Financials are based on the most recent Mortgage that was taken out on this home.
Original Mortgage
$132,457
Interest Rate
5.24%
Mortgage Type
Stand Alone Second
Purchase Details
Closed on
Aug 16, 1999
Sold by
Brighton Custom Homes
Bought by
Glass Diana
Home Financials for this Owner
Home Financials are based on the most recent Mortgage that was taken out on this home.
Original Mortgage
$130,113
Interest Rate
7.5%
Mortgage Type
FHA
Create a Home Valuation Report for This Property
The Home Valuation Report is an in-depth analysis detailing your home's value as well as a comparison with similar homes in the area
Home Values in the Area
Average Home Value in this Area
Purchase History
| Date | Buyer | Sale Price | Title Company |
|---|---|---|---|
| Bailey Stephen | $191,000 | -- | |
| Miller Rodney K | -- | -- | |
| Glass Diana | $134,000 | -- |
Source: Public Records
Mortgage History
| Date | Status | Borrower | Loan Amount |
|---|---|---|---|
| Open | Bailey Stephen | $187,951 | |
| Previous Owner | Miller Rodney K | $132,457 | |
| Previous Owner | Glass Diana | $130,113 |
Source: Public Records
Tax History Compared to Growth
Tax History
| Year | Tax Paid | Tax Assessment Tax Assessment Total Assessment is a certain percentage of the fair market value that is determined by local assessors to be the total taxable value of land and additions on the property. | Land | Improvement |
|---|---|---|---|---|
| 2025 | $3,910 | $129,784 | $30,000 | $99,784 |
| 2024 | $3,913 | $129,784 | $30,000 | $99,784 |
| 2023 | $2,478 | $82,200 | $16,000 | $66,200 |
| 2022 | $2,495 | $82,200 | $16,000 | $66,200 |
| 2021 | $2,495 | $82,200 | $16,000 | $66,200 |
| 2020 | $2,495 | $82,200 | $16,000 | $66,200 |
| 2019 | $2,250 | $74,136 | $12,000 | $62,136 |
| 2018 | $2,250 | $74,136 | $12,000 | $62,136 |
| 2017 | $1,741 | $60,572 | $12,900 | $47,672 |
| 2016 | $1,486 | $60,572 | $12,900 | $47,672 |
| 2015 | $1,524 | $60,572 | $12,900 | $47,672 |
| 2014 | $1,144 | $47,340 | $0 | $0 |
Source: Public Records
Map
Nearby Homes
- 1345 Windage Ct SW Unit 6
- 1086 Mornington Way
- 1104 Havel Dr SW
- 2615 Windage Dr SW
- 1308 Willamette Way
- 1105 Woodleigh Rd SW
- 2964 Edgemont Ln SW
- 2907 Crest Ridge Ct SW
- 3075 Milford Chase SW
- 1197 Woodleigh Rd SW
- 1020 Hicksmil Dr SW
- 3004 Michael Dr SW
- 881 Whittington Pkwy
- 2940 Caller Ct SW
- 2760 Hicks Rd SW
- 2381 Lakeside Place SW
- 1306 Waymar Way SW
- 1306 Waymar Way SW
- 1305 Waymar Way SW
- 1307 Waymar Way SW
- 1309 Waymar Way SW
- 2722 Waymar Dr SW
- 2706 Waymar Dr SW
- 1303 Waymar Way SW Unit I
- 2708 Waymar Dr SW
- 1310 Waymar Way SW Unit 1
- 2710 Waymar Dr SW
- 2720 Waymar Dr SW
- 1311 Waymar Way SW Unit 1
- 1311 Waymar Way SW Unit 30
- 1312 Waymar Way SW Unit 1
- 1312 Waymar Way SW
- 2714 Waymar Dr SW
- 1313 Waymar Way SW
- 2726 Waymar Dr SW
- 0 Waymar Dr SW Unit 7044953