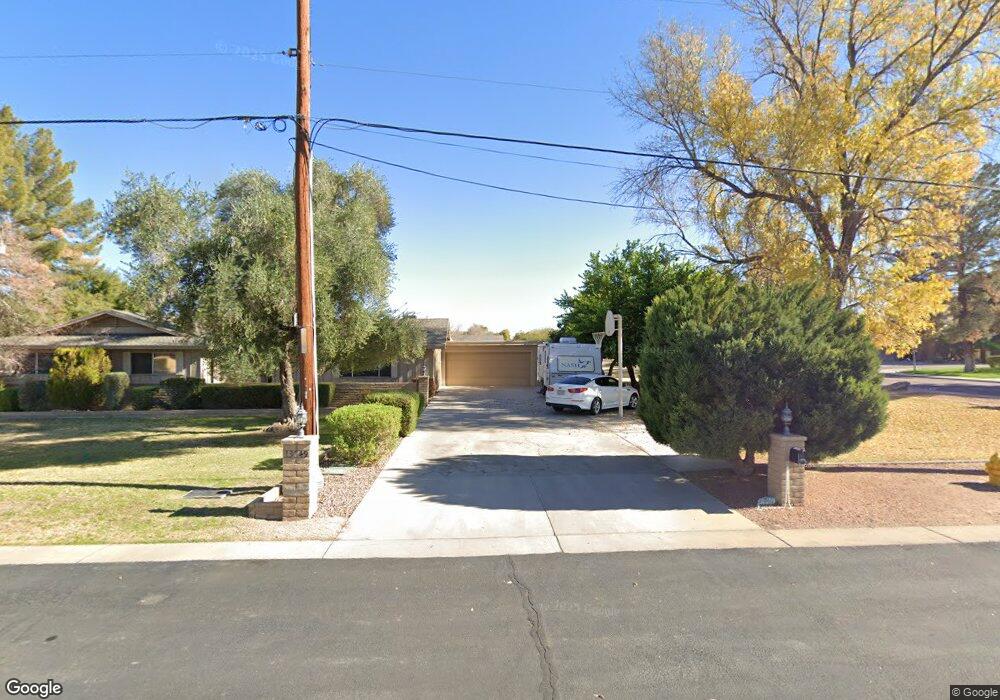
13049 S 71st St Tempe, AZ 85284
West Chandler NeighborhoodEstimated Value: $1,068,366 - $1,448,000
--
Bed
2
Baths
3,402
Sq Ft
$357/Sq Ft
Est. Value
About This Home
This home is located at 13049 S 71st St, Tempe, AZ 85284 and is currently estimated at $1,214,842, approximately $357 per square foot. 13049 S 71st St is a home located in Maricopa County with nearby schools including Kyrene de la Mariposa Elementary School, Kyrene del Pueblo Middle School, and Corona Del Sol High School.
Ownership History
Date
Name
Owned For
Owner Type
Purchase Details
Closed on
Jan 14, 2021
Sold by
Berger Janice and Berger Jan
Bought by
Berger Janice C and Berger Living Trust
Current Estimated Value
Home Financials for this Owner
Home Financials are based on the most recent Mortgage that was taken out on this home.
Original Mortgage
$250,000
Outstanding Balance
$223,126
Interest Rate
2.71%
Mortgage Type
New Conventional
Estimated Equity
$991,716
Purchase Details
Closed on
Sep 20, 2005
Sold by
Berger John W and Berger Janice C
Bought by
Berger John W and Berger Janice C
Purchase Details
Closed on
Apr 8, 2005
Sold by
Berger John W and Berger Janice C
Bought by
Berger John W and Berger Janice C
Home Financials for this Owner
Home Financials are based on the most recent Mortgage that was taken out on this home.
Original Mortgage
$370,000
Interest Rate
5.87%
Mortgage Type
Purchase Money Mortgage
Purchase Details
Closed on
Jul 14, 2000
Sold by
Berger John W and Berger Janice C
Bought by
Berger John W and Berger Janice C
Create a Home Valuation Report for This Property
The Home Valuation Report is an in-depth analysis detailing your home's value as well as a comparison with similar homes in the area
Home Values in the Area
Average Home Value in this Area
Purchase History
| Date | Buyer | Sale Price | Title Company |
|---|---|---|---|
| Berger Janice C | -- | Accommodation | |
| Berger Janice | -- | Pioneer Title Agency Inc | |
| Berger John W | -- | -- | |
| Berger John W | -- | Security Title Agency Inc | |
| Berger John W | -- | -- |
Source: Public Records
Mortgage History
| Date | Status | Borrower | Loan Amount |
|---|---|---|---|
| Open | Berger Janice | $250,000 | |
| Previous Owner | Berger John W | $370,000 |
Source: Public Records
Tax History Compared to Growth
Tax History
| Year | Tax Paid | Tax Assessment Tax Assessment Total Assessment is a certain percentage of the fair market value that is determined by local assessors to be the total taxable value of land and additions on the property. | Land | Improvement |
|---|---|---|---|---|
| 2025 | $6,812 | $67,974 | -- | -- |
| 2024 | $6,409 | $64,737 | -- | -- |
| 2023 | $6,409 | $85,470 | $17,090 | $68,380 |
| 2022 | $6,084 | $64,620 | $12,920 | $51,700 |
| 2021 | $6,234 | $63,070 | $12,610 | $50,460 |
| 2020 | $6,083 | $61,020 | $12,200 | $48,820 |
| 2019 | $5,884 | $56,730 | $11,340 | $45,390 |
| 2018 | $5,687 | $50,900 | $10,180 | $40,720 |
| 2017 | $5,446 | $50,420 | $10,080 | $40,340 |
| 2016 | $5,499 | $53,380 | $10,670 | $42,710 |
| 2015 | $5,025 | $54,210 | $10,840 | $43,370 |
Source: Public Records
Map
Nearby Homes
- 843 E Vera Ln
- 12651 S 71st St
- 1001 E Caroline Ln
- 9276 S Myrtle Ave
- 4922 W Gail Dr
- 61 E Dawn Dr
- 8938 S Forest Ave
- 4804 W Gail Dr
- 260 E Rhea Rd
- 1101 E Warner Rd Unit 117
- 7026 E Warner Rd
- 42 W La Vieve Ln
- 4619 W Orchid Ln
- 4830 W Shannon Ct
- 4820 W Shannon Ct
- 91 W Calle de Arcos
- 9011 S Dateland Dr
- 8629 S Stanley Place
- 5170 W Ivanhoe St
- 1444 E Myrna Ln
- 13030 S 71st St
- 9409 S La Rosa Dr
- 13050 S 71st St
- 9432 S La Rosa Dr
- 9427 S La Rosa Dr
- 13019 S 71st St
- 13019 S 71st St
- 13010 S 71st St Unit 1400
- 13010 S 71st St
- 9430 S Palm Dr
- 9450 S La Rosa Dr
- 13001 S 71st St
- 9468 S La Rosa Dr
- 9448 S Palm Dr
- 9463 S La Rosa Dr
- 13002 S 71st St
- 9411 S Palm Dr
- 9466 S Palm Dr
- 9486 S La Rosa Dr
- 9429 S Palm Dr