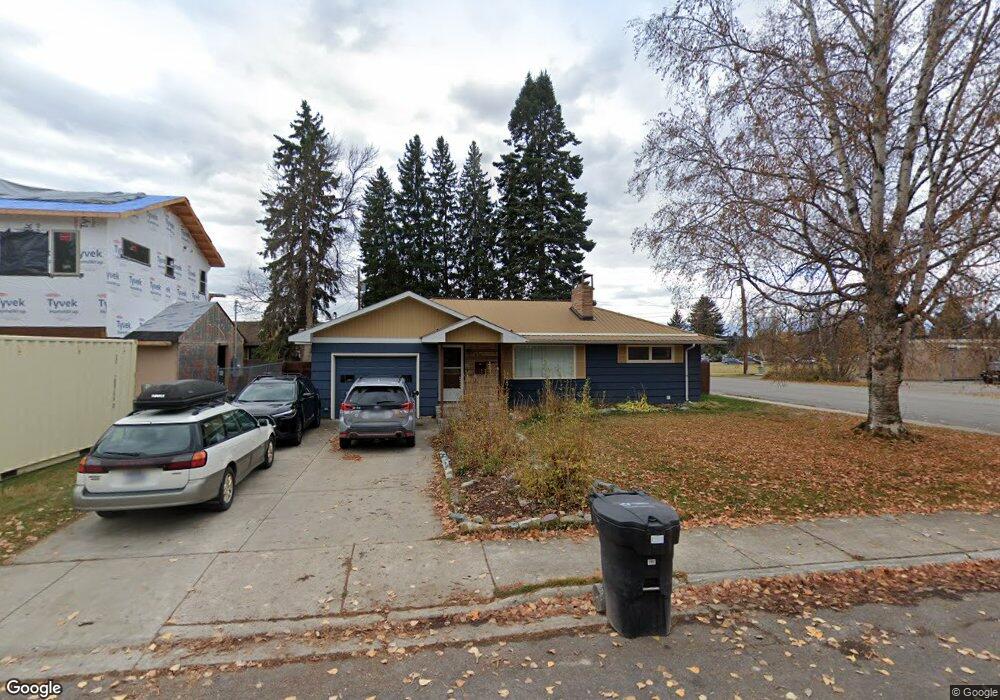
1305 3rd St Whitefish, MT 59937
Estimated Value: $596,000 - $943,000
3
Beds
2
Baths
1,623
Sq Ft
$488/Sq Ft
Est. Value
About This Home
This home is located at 1305 3rd St, Whitefish, MT 59937 and is currently estimated at $791,486, approximately $487 per square foot. 1305 3rd St is a home located in Flathead County with nearby schools including L.A. Muldown School, Whitefish Middle School, and Whitefish High School.
Ownership History
Date
Name
Owned For
Owner Type
Purchase Details
Closed on
Aug 28, 2019
Sold by
Sean Properties Llc
Bought by
Qunell Jessica
Current Estimated Value
Home Financials for this Owner
Home Financials are based on the most recent Mortgage that was taken out on this home.
Original Mortgage
$307,000
Outstanding Balance
$269,839
Interest Rate
3.77%
Mortgage Type
Adjustable Rate Mortgage/ARM
Estimated Equity
$521,647
Purchase Details
Closed on
Sep 12, 2016
Sold by
Louchard Edward P and Leitman Amy
Bought by
Sean Properties Llc
Purchase Details
Closed on
Jun 13, 2016
Sold by
Clark Craig E and Clark Deborah N
Bought by
Lochard Edward P and Leitman Amy
Purchase Details
Closed on
Sep 5, 2007
Sold by
Donaldson Mark and Donaldson Lynnette
Bought by
Clark Craig E and Clark Deborah N
Home Financials for this Owner
Home Financials are based on the most recent Mortgage that was taken out on this home.
Original Mortgage
$116,000
Interest Rate
6.57%
Mortgage Type
New Conventional
Create a Home Valuation Report for This Property
The Home Valuation Report is an in-depth analysis detailing your home's value as well as a comparison with similar homes in the area
Home Values in the Area
Average Home Value in this Area
Purchase History
| Date | Buyer | Sale Price | Title Company |
|---|---|---|---|
| Qunell Jessica | -- | Fidelity National Title | |
| Sean Properties Llc | -- | Accommodation | |
| Lochard Edward P | -- | Fidelity National Title | |
| Clark Craig E | -- | Sterling Title Services Inc |
Source: Public Records
Mortgage History
| Date | Status | Borrower | Loan Amount |
|---|---|---|---|
| Open | Qunell Jessica | $307,000 | |
| Previous Owner | Clark Craig E | $116,000 |
Source: Public Records
Tax History
| Year | Tax Paid | Tax Assessment Tax Assessment Total Assessment is a certain percentage of the fair market value that is determined by local assessors to be the total taxable value of land and additions on the property. | Land | Improvement |
|---|---|---|---|---|
| 2025 | $2,447 | $707,100 | $0 | $0 |
| 2024 | $2,869 | $573,400 | $0 | $0 |
| 2023 | $3,225 | $573,400 | $0 | $0 |
| 2022 | $2,989 | $363,800 | $0 | $0 |
| 2021 | $3,005 | $363,800 | $0 | $0 |
| 2020 | $3,274 | $364,500 | $0 | $0 |
| 2019 | $3,504 | $364,500 | $0 | $0 |
| 2018 | $2,922 | $291,900 | $0 | $0 |
| 2017 | $2,712 | $291,900 | $0 | $0 |
| 2016 | $2,289 | $240,700 | $0 | $0 |
| 2015 | $2,305 | $240,700 | $0 | $0 |
| 2014 | $2,466 | $156,509 | $0 | $0 |
Source: Public Records
Map
Nearby Homes
- 1319 3rd St
- 1050 E 4th St
- 20 Fir Ave
- 555 Park Ave
- 5 Park Ave Unit Lot 19 & 20
- 602 Park Ave
- 1013 E 7th St Unit D
- 711 Park Ave
- 84 Wedgewood Ln
- 560 Columbia Ave
- 620 E 6th St
- 573 Armory Rd
- 301 2nd St E Unit 2D
- 841, 845, 851 Baker Ave
- NHN Baker Ave
- 22 Lupfer Ave Unit 202
- 220 2nd St E Unit 202
- 214 2nd St E Unit Suite 302
- 214 2nd St E Unit Suite 201
- 214 2nd St E Unit Suite 301
Your Personal Tour Guide
Ask me questions while you tour the home.