A
Seller's Agent in 2023
Amanda Wiley & K Team
Era All In One Realty
(229) 357-0489
40 in this area
2,572 Total Sales
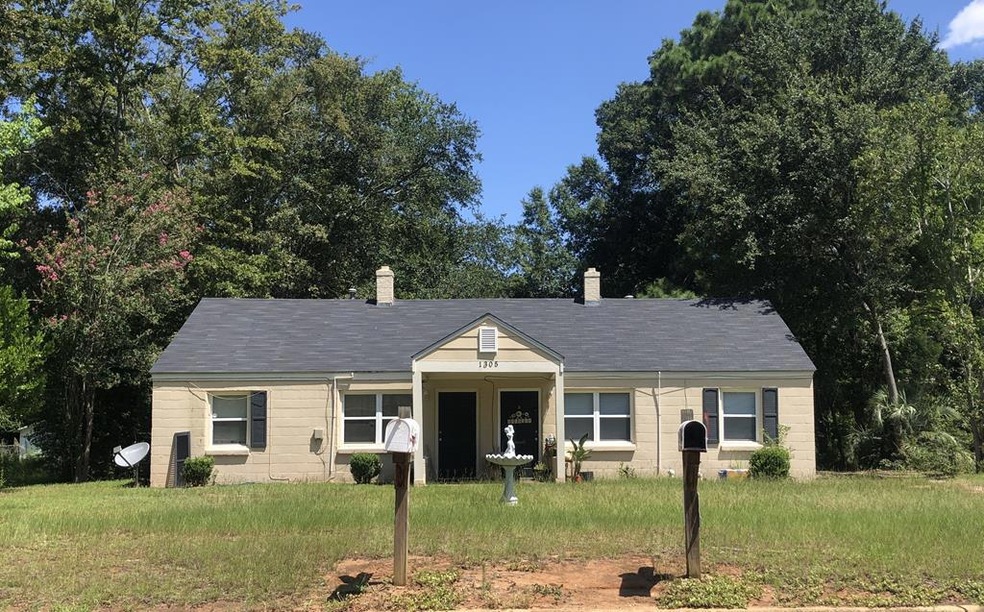

Estimated Value: $86,000 - $123,000
EXCELLENT DUPLEX ON THE AVENUES! LONG TERM TENANTS! ROOF ONLY 5 YEARS OLD! This concrete block duplex has 2 bedrooms and 1 bath on each side! Fireplace on each side! One of the units has a carport! The total monthly rent is $900 with room for an increase! Long term tenants! Great area that is close to everything!
Last Agent to Sell the Property
Era All In One Realty Brokerage Phone: 2298886670 License #309999 Listed on: 12/20/2022
Last Buyer's Agent
chad williams
Cobblestone Realty Partners License #411894
| Date | Buyer | Sale Price | Title Company |
|---|---|---|---|
| Wingate Williams Holdings Llc | $83,000 | -- | |
| Johnson Beverly Farr | -- | -- | |
| Johnson Tommy | $47,000 | -- | |
| Raburn Charlie | $35,500 | -- | |
| Weith Bonnie D | $35,000 | -- | |
| Dees Irma Drummond | -- | -- |
| Date | Event | Price | List to Sale | Price per Sq Ft |
|---|---|---|---|---|
| 01/06/2023 01/06/23 | Sold | $83,000 | -- | $61 / Sq Ft |
| 12/20/2022 12/20/22 | Pending | -- | -- | -- |
| Year | Tax Paid | Tax Assessment Tax Assessment Total Assessment is a certain percentage of the fair market value that is determined by local assessors to be the total taxable value of land and additions on the property. | Land | Improvement |
|---|---|---|---|---|
| 2025 | $1,327 | $26,200 | $6,080 | $20,120 |
| 2024 | $1,327 | $26,200 | $6,080 | $20,120 |
| 2023 | $1,209 | $25,960 | $6,080 | $19,880 |
| 2022 | $1,214 | $25,960 | $6,080 | $19,880 |
| 2021 | $1,125 | $25,960 | $6,080 | $19,880 |
| 2020 | $1,128 | $25,960 | $6,080 | $19,880 |
| 2019 | $1,132 | $25,960 | $6,080 | $19,880 |
| 2018 | $1,137 | $25,960 | $6,080 | $19,880 |
| 2017 | $1,059 | $25,960 | $6,080 | $19,880 |
| 2016 | $1,060 | $25,960 | $6,080 | $19,880 |
| 2015 | $1,063 | $25,960 | $6,080 | $19,880 |
| 2014 | $1,111 | $27,480 | $7,600 | $19,880 |
A
Seller's Agent in 2023
Amanda Wiley & K Team
Era All In One Realty
(229) 357-0489
40 in this area
2,572 Total Sales
c
Buyer's Agent in 2023
chad williams
Cobblestone Realty Partners
Source: Albany Board of REALTORS®
MLS Number: 151041
APN: 0000G-00013-006
Ask me questions while you tour the home.
