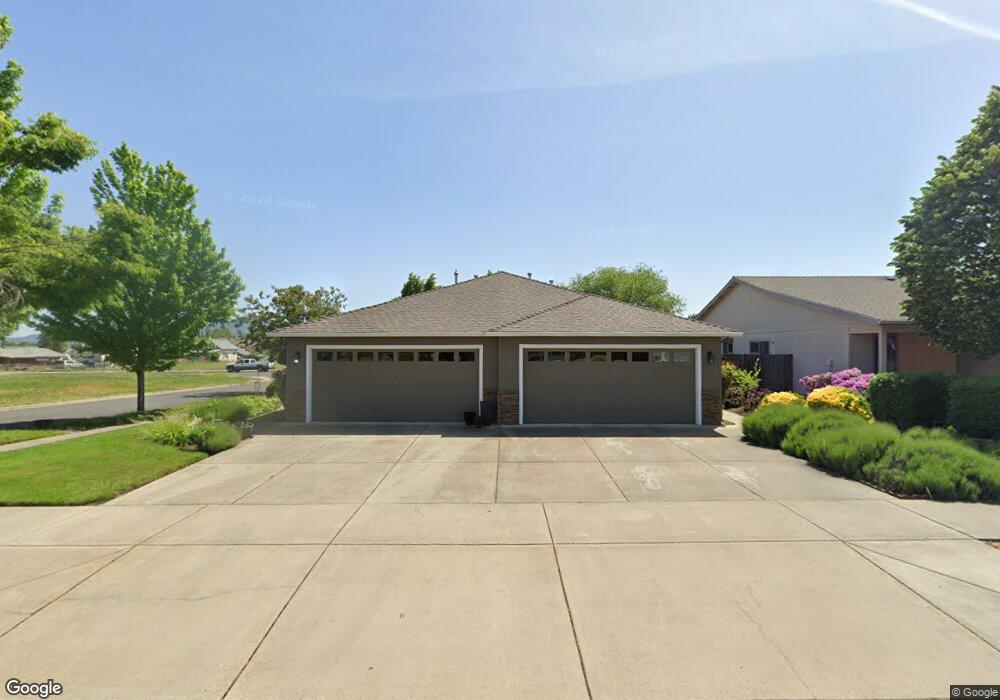
1305 Alex Way Unit 9 Medford, OR 97501
Southwest Medford NeighborhoodEstimated Value: $346,000 - $488,595
4
Beds
4
Baths
2,100
Sq Ft
$205/Sq Ft
Est. Value
About This Home
This home is located at 1305 Alex Way Unit 9, Medford, OR 97501 and is currently estimated at $431,149, approximately $205 per square foot. 1305 Alex Way Unit 9 is a home located in Jackson County with nearby schools including Oak Grove Elementary School, McLoughlin Middle School, and South Medford High School.
Ownership History
Date
Name
Owned For
Owner Type
Purchase Details
Closed on
Jun 4, 2018
Sold by
Bright William L and Bright Victoria M
Bought by
Bright William L and Bright Victoria M
Current Estimated Value
Purchase Details
Closed on
May 5, 2004
Sold by
Rossetto Keith F and Keith Rossetto Construction
Bought by
Bright William L and Bright Victoria M
Home Financials for this Owner
Home Financials are based on the most recent Mortgage that was taken out on this home.
Original Mortgage
$217,000
Outstanding Balance
$104,383
Interest Rate
5.87%
Mortgage Type
Purchase Money Mortgage
Estimated Equity
$326,766
Purchase Details
Closed on
Jul 9, 2003
Sold by
Pactrend Inc
Bought by
Coffman Ron D and Coffman Adelia A
Purchase Details
Closed on
May 8, 2003
Sold by
Mt Valley Associates Llc
Bought by
Ward James B and Ward Vicki
Home Financials for this Owner
Home Financials are based on the most recent Mortgage that was taken out on this home.
Original Mortgage
$94,500
Interest Rate
5.84%
Purchase Details
Closed on
Mar 4, 2003
Sold by
Redha Corp
Bought by
Rossetto Keith F and Keith Rossetto Construction
Purchase Details
Closed on
Dec 4, 2002
Sold by
Redha Corp Inc
Bought by
De Carlow Homes Inc
Create a Home Valuation Report for This Property
The Home Valuation Report is an in-depth analysis detailing your home's value as well as a comparison with similar homes in the area
Home Values in the Area
Average Home Value in this Area
Purchase History
| Date | Buyer | Sale Price | Title Company |
|---|---|---|---|
| Bright William L | -- | None Available | |
| Bright William L | $270,000 | Amerititle | |
| Coffman Ron D | $269,900 | Amerititle | |
| Ward James B | -- | Amerititle | |
| Rossetto Keith F | -- | Amerititle | |
| De Carlow Homes Inc | -- | -- |
Source: Public Records
Mortgage History
| Date | Status | Borrower | Loan Amount |
|---|---|---|---|
| Open | Bright William L | $217,000 | |
| Previous Owner | Ward James B | $94,500 |
Source: Public Records
Tax History Compared to Growth
Tax History
| Year | Tax Paid | Tax Assessment Tax Assessment Total Assessment is a certain percentage of the fair market value that is determined by local assessors to be the total taxable value of land and additions on the property. | Land | Improvement |
|---|---|---|---|---|
| 2025 | $3,296 | $227,250 | $63,770 | $163,480 |
| 2024 | $3,296 | $220,640 | $61,910 | $158,730 |
| 2023 | $3,195 | $214,220 | $60,110 | $154,110 |
| 2022 | $3,117 | $214,220 | $60,110 | $154,110 |
| 2021 | $3,037 | $207,990 | $58,360 | $149,630 |
| 2020 | $2,972 | $201,940 | $56,650 | $145,290 |
| 2019 | $2,902 | $190,350 | $53,400 | $136,950 |
| 2018 | $2,828 | $184,810 | $60,410 | $124,400 |
| 2017 | $2,777 | $184,810 | $60,410 | $124,400 |
| 2016 | $2,795 | $174,210 | $56,940 | $117,270 |
| 2015 | $2,687 | $174,210 | $56,940 | $117,270 |
| 2014 | $2,639 | $164,220 | $53,670 | $110,550 |
Source: Public Records
Map
Nearby Homes
- 1907 Layla Dr
- 2554 W Stewart Ave
- 1322 Orchard Home Dr
- 963 Lozier Ln
- 0 Aster St
- 2680 Willow Way
- 1747 Fallen Leaf Dr Unit 18C
- 1745 Fallen Leaf Dr Unit 17C
- 1743 Fallen Leaf Dr Unit 16C
- 1727 Fallen Leaf Dr Unit 10C
- 1741 Fallen Leaf Dr Unit 15V
- 1725 Fallen Leaf Dr Unit 9V
- 1723 Fallen Leaf Dr Unit 8C
- 1721 Fallen Leaf Dr Unit 7V
- 1703 Fallen Leaf Dr Unit 2H
- 1701 Fallen Leaf Dr Unit 1B
- 2710 W Stewart Ave
- 0 Gaylee Ave Unit 351 220191598
- 695 Lozier Ln
- 1300 Dixie Ln
- 1315 Alex Way Unit 19
- 1321 Alex Way Unit 25
- 1304 Alex Way
- 1310 Alex Way
- 1327 Alex Way Unit 31
- 1316 Alex Way
- 0 Alex Way
- 1322 Alex Way
- 1307 Andrew Dr
- 1333 Alex Way Unit 37
- 1319 Andrew Dr
- 1328 Alex Way
- 1325 Andrew Dr
- 2335 W Stewart Ave
- 1334 Alex Way
- 2210 Arlington Dr Unit 14
- 2224 Arlington Dr
- 1331 Andrew Dr
- 2202 Arlington Dr Unit 8
- 2325 W Stewart Ave