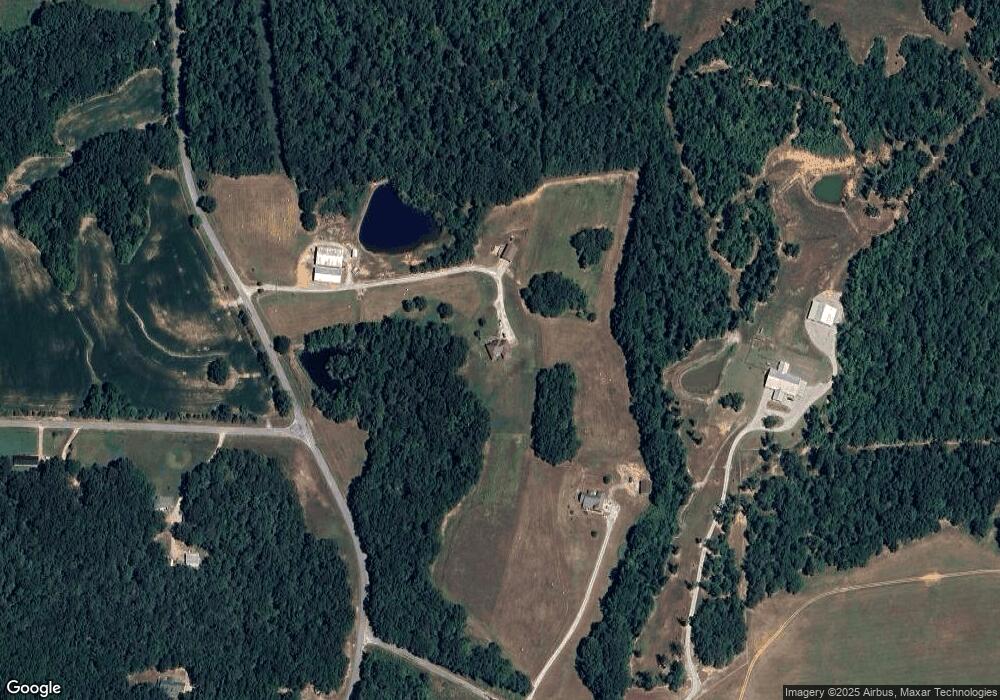
1305 Bateman Rd Moscow, TN 38057
Estimated Value: $386,000 - $756,000
--
Bed
4
Baths
2,059
Sq Ft
$254/Sq Ft
Est. Value
About This Home
This home is located at 1305 Bateman Rd, Moscow, TN 38057 and is currently estimated at $522,485, approximately $253 per square foot. 1305 Bateman Rd is a home located in Fayette County with nearby schools including La Grange Moscow Elementary School, East Junior High School, and Fayette Ware Comprehensive High School.
Ownership History
Date
Name
Owned For
Owner Type
Purchase Details
Closed on
Jan 19, 2023
Sold by
Holcom James E and Holcom Patsy K
Bought by
Holcomb Asset Protection Trust
Current Estimated Value
Purchase Details
Closed on
Aug 12, 2008
Sold by
Holcomb James E
Bought by
Holcomb Barry J
Home Financials for this Owner
Home Financials are based on the most recent Mortgage that was taken out on this home.
Original Mortgage
$40,000
Interest Rate
6.32%
Mortgage Type
New Conventional
Purchase Details
Closed on
Sep 26, 1997
Sold by
Watkins Larry W and Watkins Martha M
Bought by
Holcomb James E and Holcomb Patsy K
Purchase Details
Closed on
Sep 10, 1992
Bought by
Watkins Larry W and Watkins Martha M
Purchase Details
Closed on
May 1, 1992
Purchase Details
Closed on
Feb 28, 1992
Bought by
Morton Fred Read and Morton Martha
Purchase Details
Closed on
Mar 30, 1981
Bought by
Morton Fred and Morton Martha
Create a Home Valuation Report for This Property
The Home Valuation Report is an in-depth analysis detailing your home's value as well as a comparison with similar homes in the area
Home Values in the Area
Average Home Value in this Area
Purchase History
| Date | Buyer | Sale Price | Title Company |
|---|---|---|---|
| Holcomb Asset Protection Trust | -- | -- | |
| Holcomb Barry J | -- | -- | |
| Miller Bryan | -- | -- | |
| Holcomb James E | $100,000 | -- | |
| Watkins Larry W | $85,300 | -- | |
| -- | $66,000 | -- | |
| Morton Fred Read | -- | -- | |
| -- | -- | -- | |
| Morton Fred | -- | -- |
Source: Public Records
Mortgage History
| Date | Status | Borrower | Loan Amount |
|---|---|---|---|
| Previous Owner | Miller Bryan | $40,000 |
Source: Public Records
Tax History Compared to Growth
Tax History
| Year | Tax Paid | Tax Assessment Tax Assessment Total Assessment is a certain percentage of the fair market value that is determined by local assessors to be the total taxable value of land and additions on the property. | Land | Improvement |
|---|---|---|---|---|
| 2024 | $744 | $57,625 | $8,875 | $48,750 |
| 2023 | $744 | $57,625 | $0 | $0 |
| 2022 | $744 | $57,625 | $8,875 | $48,750 |
| 2021 | $744 | $57,625 | $8,875 | $48,750 |
| 2020 | $791 | $57,625 | $8,875 | $48,750 |
| 2019 | $791 | $52,450 | $8,050 | $44,400 |
| 2018 | $791 | $52,450 | $8,050 | $44,400 |
| 2017 | $791 | $52,450 | $8,050 | $44,400 |
| 2016 | $802 | $49,925 | $7,875 | $42,050 |
| 2015 | $802 | $49,925 | $7,875 | $42,050 |
| 2014 | $779 | $48,500 | $7,875 | $40,625 |
Source: Public Records
Map
Nearby Homes