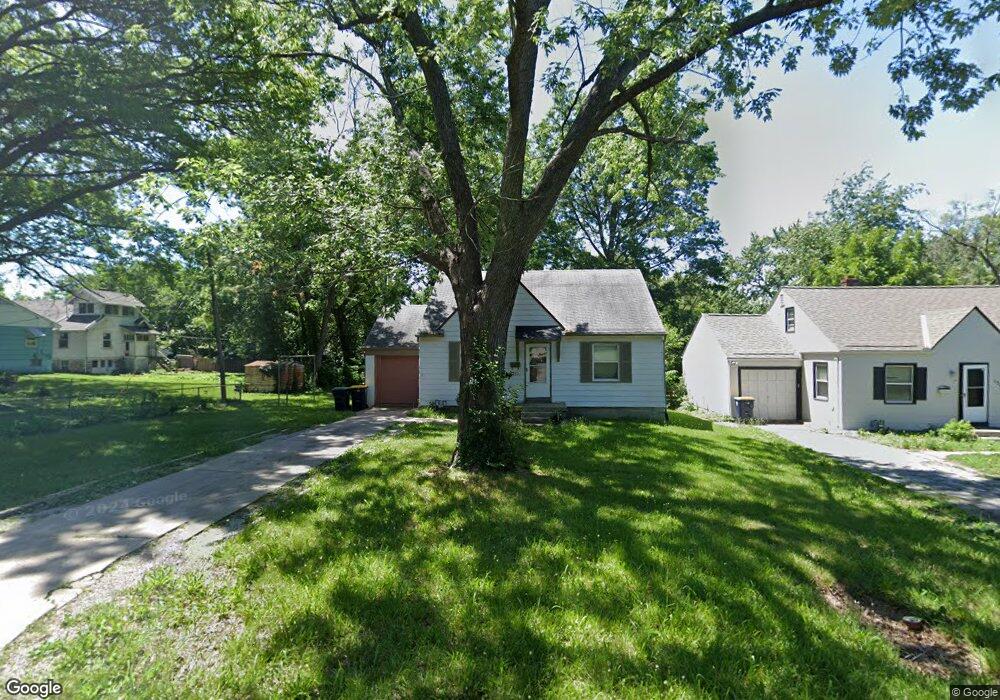
1305 E 79th St Kansas City, MO 64131
Marlborough Heights/Pride NeighborhoodEstimated Value: $106,000 - $186,000
3
Beds
1
Bath
1,196
Sq Ft
$118/Sq Ft
Est. Value
About This Home
This home is located at 1305 E 79th St, Kansas City, MO 64131 and is currently estimated at $140,974, approximately $117 per square foot. 1305 E 79th St is a home located in Jackson County with nearby schools including Center Elementary, Center Middle School, and Center High School.
Ownership History
Date
Name
Owned For
Owner Type
Purchase Details
Closed on
Apr 20, 2001
Sold by
The Chase Manhattan Bank
Bought by
Bush Mark and Bush Constance
Current Estimated Value
Home Financials for this Owner
Home Financials are based on the most recent Mortgage that was taken out on this home.
Original Mortgage
$36,900
Outstanding Balance
$13,471
Interest Rate
6.89%
Mortgage Type
Purchase Money Mortgage
Estimated Equity
$127,503
Purchase Details
Closed on
Nov 16, 2000
Sold by
Sampson Leona C and Sampson Melvin D
Bought by
First Franklin Mtg Loan Asset Backed Cer
Purchase Details
Closed on
Nov 30, 1999
Sold by
E & R Investments Inc
Bought by
Sampson Melvin D and Sampson Leona C
Home Financials for this Owner
Home Financials are based on the most recent Mortgage that was taken out on this home.
Original Mortgage
$54,750
Interest Rate
11.37%
Mortgage Type
Purchase Money Mortgage
Create a Home Valuation Report for This Property
The Home Valuation Report is an in-depth analysis detailing your home's value as well as a comparison with similar homes in the area
Home Values in the Area
Average Home Value in this Area
Purchase History
| Date | Buyer | Sale Price | Title Company |
|---|---|---|---|
| Bush Mark | -- | Chicago Title Co | |
| First Franklin Mtg Loan Asset Backed Cer | $40,800 | First American Title Ins | |
| Sampson Melvin D | -- | Security Land Title Co |
Source: Public Records
Mortgage History
| Date | Status | Borrower | Loan Amount |
|---|---|---|---|
| Open | Bush Mark | $36,900 | |
| Previous Owner | Sampson Melvin D | $54,750 | |
| Closed | Sampson Melvin D | $18,250 |
Source: Public Records
Tax History
| Year | Tax Paid | Tax Assessment Tax Assessment Total Assessment is a certain percentage of the fair market value that is determined by local assessors to be the total taxable value of land and additions on the property. | Land | Improvement |
|---|---|---|---|---|
| 2025 | $930 | $8,292 | $3,040 | $5,252 |
| 2024 | $921 | $11,784 | $7,744 | $4,040 |
| 2023 | $921 | $11,784 | $1,241 | $10,543 |
| 2022 | $516 | $6,270 | $2,679 | $3,591 |
| 2021 | $514 | $6,270 | $2,679 | $3,591 |
| 2020 | $522 | $6,284 | $2,679 | $3,605 |
| 2019 | $511 | $6,284 | $2,679 | $3,605 |
| 2018 | $475 | $5,964 | $1,454 | $4,510 |
| 2017 | $475 | $5,964 | $1,454 | $4,510 |
| 2016 | $465 | $5,814 | $1,147 | $4,667 |
Source: Public Records
Map
Nearby Homes
- 1434 E 80th St
- 8004 Lydia Ave
- 1314 E 81st St
- 1400 E 77th Terrace
- 1116 E 77th Terrace
- 1607 E 79th St
- 1174 E 77th St
- 1404 E 77th St
- 1445 E 77th St
- 8136 Flora Ave
- 1321 E 76th St
- 8140 Troost Ave
- 1122 E 76th St
- 845 E 77th St
- 7903 Holmes Rd
- 1603 E 82nd St
- 8217 Flora Ave
- 1518 E 76th St
- 1025 E 76th St
- 1141 E 75th Terrace
- 1303 E 79th St
- 1301 E 79th St
- 1312 E 79th St
- 7900 Virginia Ave
- 7904 Virginia Ave
- 1223 E 79th St
- 7908 Virginia Ave
- 1222 E 79th St
- 1322 E 79th St
- 7916 Virginia Ave
- 1219 E 79th St
- 1326 E 79th St
- 1218 E 79th St
- 1330 E 79th St
- 1308 E 80th St
- 1215 E 79th St
- 7909 Virginia Ave
- 1304 E 80th St
- 1216 E 79th St
- 7924 Virginia Ave
Your Personal Tour Guide
Ask me questions while you tour the home.