1305 Maple St Muskogee, OK 74403
Central Muskogee NeighborhoodEstimated Value: $117,000 - $148,106
3
Beds
2
Baths
1,748
Sq Ft
$75/Sq Ft
Est. Value
About This Home
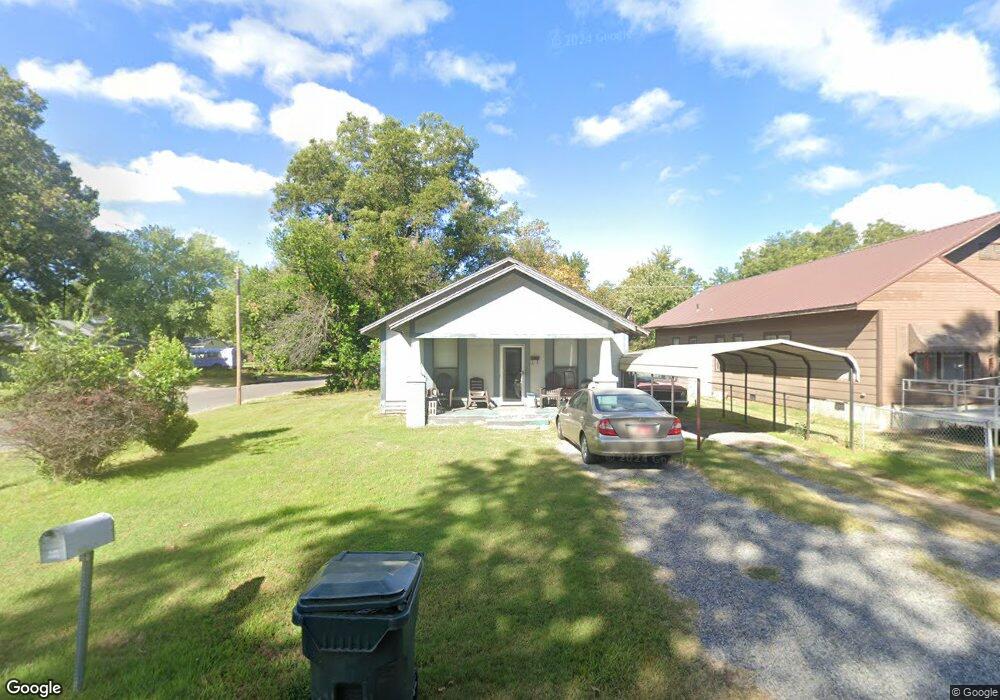
This home is located at 1305 Maple St, Muskogee, OK 74403 and is currently estimated at $131,277, approximately $75 per square foot. 1305 Maple St is a home located in Muskogee County with nearby schools including Irving Elementary School, 8th & 9th Grade Academy @ Alice Robertson, and Muskogee High School.
Ownership History
Date
Name
Owned For
Owner Type
Purchase Details
Closed on
Jun 21, 2024
Sold by
Russellynne Schultz Revocable Trust and Schultz Jack A
Bought by
Schultz Family Revocable Trust and Schultz
Current Estimated Value
Purchase Details
Closed on
Nov 25, 2022
Sold by
Schultz Family Trust
Bought by
Russellynne Schultz Revocable Trust
Purchase Details
Closed on
Jul 20, 2020
Sold by
Schultz Jack Allen and Schultz Russellynne
Bought by
Schultz Jack Allen and Schultz Russellynne
Create a Home Valuation Report for This Property
The Home Valuation Report is an in-depth analysis detailing your home's value as well as a comparison with similar homes in the area
Home Values in the Area
Average Home Value in this Area
Purchase History
| Date | Buyer | Sale Price | Title Company |
|---|---|---|---|
| Schultz Family Revocable Trust | -- | None Listed On Document | |
| Russellynne Schultz Revocable Trust | -- | -- | |
| Schultz Jack Allen | -- | None Available |
Source: Public Records
Tax History
| Year | Tax Paid | Tax Assessment Tax Assessment Total Assessment is a certain percentage of the fair market value that is determined by local assessors to be the total taxable value of land and additions on the property. | Land | Improvement |
|---|---|---|---|---|
| 2025 | -- | $9,912 | $1,037 | $8,875 |
| 2024 | -- | $9,623 | $1,007 | $8,616 |
| 2023 | $0 | $9,624 | $949 | $8,675 |
| 2022 | $794 | $9,343 | $925 | $8,418 |
| 2021 | $0 | $8,807 | $880 | $7,927 |
| 2020 | $794 | $8,807 | $880 | $7,927 |
| 2019 | $794 | $8,807 | $880 | $7,927 |
| 2018 | $794 | $8,807 | $880 | $7,927 |
| 2017 | $794 | $8,333 | $880 | $7,453 |
| 2016 | $771 | $8,091 | $880 | $7,211 |
| 2015 | $755 | $7,855 | $880 | $6,975 |
| 2014 | $1 | $7,626 | $880 | $6,746 |
Source: Public Records
Map
Nearby Homes
Your Personal Tour Guide
Ask me questions while you tour the home.