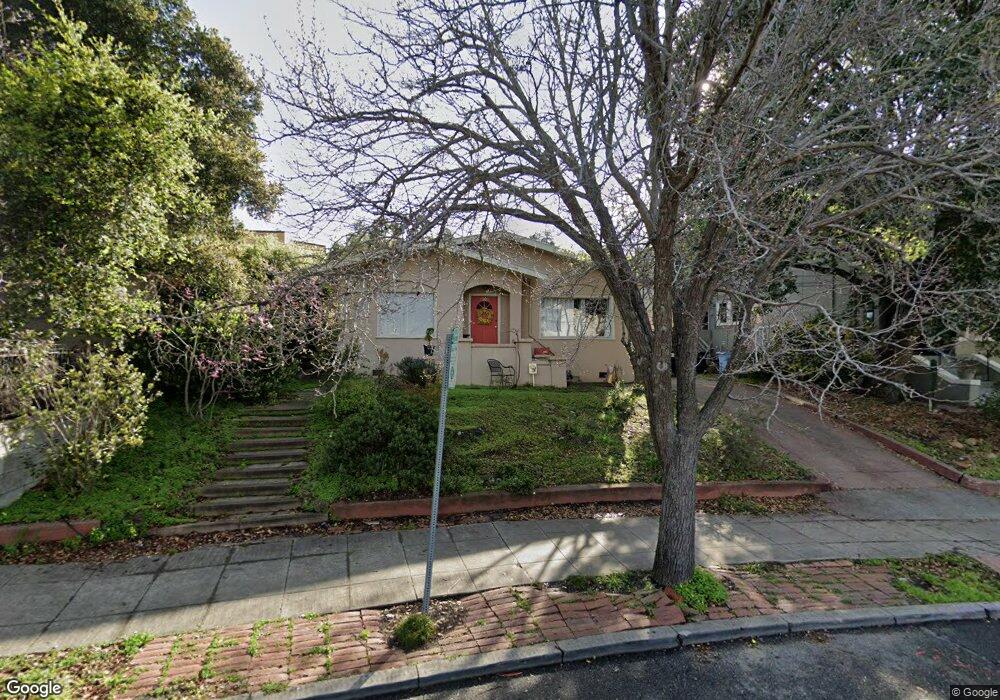
1305 Oxford St Berkeley, CA 94709
North Berkeley NeighborhoodEstimated Value: $1,508,070 - $1,758,000
3
Beds
2
Baths
1,610
Sq Ft
$1,003/Sq Ft
Est. Value
About This Home
This home is located at 1305 Oxford St, Berkeley, CA 94709 and is currently estimated at $1,615,018, approximately $1,003 per square foot. 1305 Oxford St is a home located in Alameda County with nearby schools including Berkeley Arts Magnet at Whittier School, Cragmont Elementary School, and Washington Elementary School.
Ownership History
Date
Name
Owned For
Owner Type
Purchase Details
Closed on
Apr 17, 2017
Sold by
Hadley Christina
Bought by
Liang Chin Chia and Curran Christopher
Current Estimated Value
Purchase Details
Closed on
Jun 5, 2014
Sold by
Kirsten Klotz Matthias and Kirsten Rauschendorf
Bought by
Hadley Christina
Home Financials for this Owner
Home Financials are based on the most recent Mortgage that was taken out on this home.
Original Mortgage
$472,314
Interest Rate
4.25%
Mortgage Type
New Conventional
Purchase Details
Closed on
Feb 12, 2013
Sold by
Wengraf Susan E and Berger Mark
Bought by
Berger Wengraf Living Trust
Purchase Details
Closed on
Jun 27, 2000
Sold by
Will Robin C
Bought by
Winn Robin C and Walsh Yarrow M
Purchase Details
Closed on
Mar 4, 1999
Sold by
Yarrow Walsh
Bought by
Winn Robin C
Purchase Details
Closed on
Dec 18, 1997
Sold by
Berger Mark and Berger Susan E
Bought by
Berger Mark N and Wengraf Susan E
Create a Home Valuation Report for This Property
The Home Valuation Report is an in-depth analysis detailing your home's value as well as a comparison with similar homes in the area
Home Values in the Area
Average Home Value in this Area
Purchase History
| Date | Buyer | Sale Price | Title Company |
|---|---|---|---|
| Liang Chin Chia | $1,080,000 | Chicago Title Company | |
| Hadley Christina | $706,000 | Chicago Title Company | |
| Berger Wengraf Living Trust | -- | None Available | |
| Winn Robin C | -- | -- | |
| Winn Robin C | -- | -- | |
| Berger Mark N | -- | -- |
Source: Public Records
Mortgage History
| Date | Status | Borrower | Loan Amount |
|---|---|---|---|
| Previous Owner | Hadley Christina | $472,314 |
Source: Public Records
Tax History
| Year | Tax Paid | Tax Assessment Tax Assessment Total Assessment is a certain percentage of the fair market value that is determined by local assessors to be the total taxable value of land and additions on the property. | Land | Improvement |
|---|---|---|---|---|
| 2025 | $11,047 | $530,483 | $159,145 | $371,338 |
| 2024 | $11,047 | $520,082 | $156,024 | $364,058 |
| 2023 | $10,735 | $509,885 | $152,965 | $356,920 |
| 2022 | $10,427 | $499,890 | $149,967 | $349,923 |
| 2021 | $10,416 | $490,088 | $147,026 | $343,062 |
| 2020 | $9,754 | $485,063 | $145,519 | $339,544 |
| 2019 | $9,249 | $475,553 | $142,666 | $332,887 |
| 2018 | $8,909 | $466,230 | $139,869 | $326,361 |
| 2017 | $8,714 | $457,088 | $137,126 | $319,962 |
| 2016 | $8,339 | $448,127 | $134,438 | $313,689 |
| 2015 | $8,206 | $441,398 | $132,419 | $308,979 |
| 2014 | $8,053 | $432,752 | $129,825 | $302,927 |
Source: Public Records
Map
Nearby Homes
- 2121 Eunice St
- 1444 Walnut St
- 2315 Eunice St
- 1515 Oxford St Unit 1D
- 1408 Henry St
- 2501 Rose Walk
- 1622 Scenic Ave
- 1950 Hopkins St
- 1425 Martin Luther King jr Way
- 2421 Hilgard Ave
- 1682 Oxford St
- 2201 Virginia St Unit 2
- 1841 Vine St
- 1610 Milvia St
- 2340 Virginia St
- 2477 Virginia St
- 1609 Bonita Ave Unit 5
- 1004 Cragmont Ave
- 2686 Shasta Rd
- 1739 Spruce St
- 1311 Oxford St
- 1313 Oxford St
- 1315 Oxford St
- 1316 Spruce St
- 1314 Spruce St
- 0 Glen Ave
- 1320 Spruce St
- 1324 Spruce St
- 1323 Oxford St
- 1300 Oxford St
- 1308 Oxford St Unit upper
- 1308 Oxford St
- 1326 Spruce St
- 1327 Oxford St
- 1298 Oxford St
- 1312 Oxford St
- 1296 Oxford St
- 1324 Oxford St
- 1328 Spruce St
- 1294 Oxford St
Your Personal Tour Guide
Ask me questions while you tour the home.