Estimated Value: $730,000 - $780,000
3
Beds
2
Baths
1,479
Sq Ft
$507/Sq Ft
Est. Value
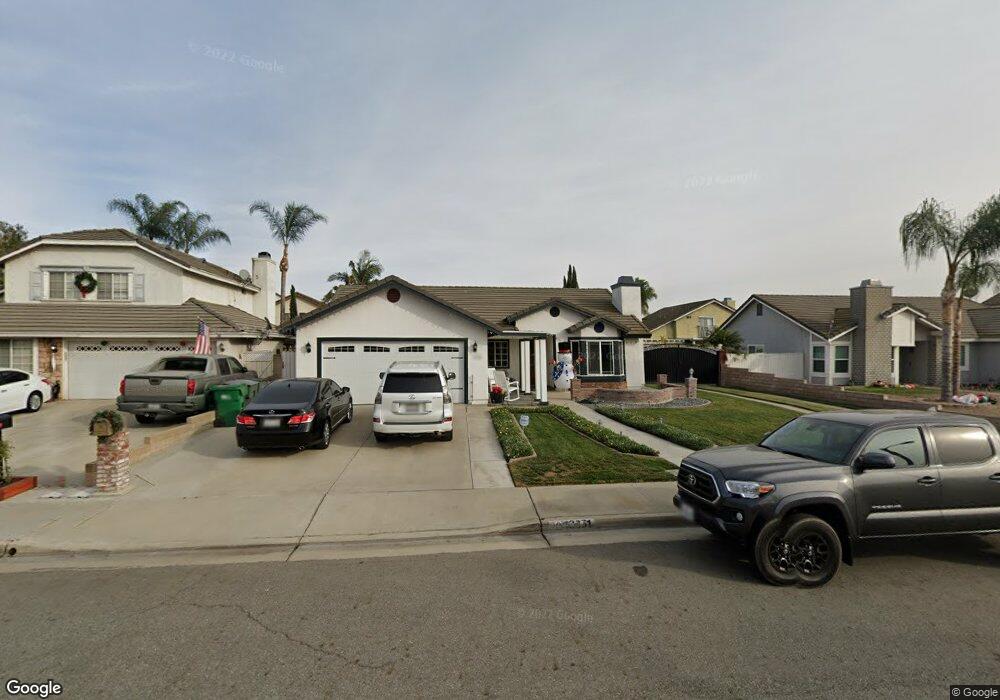
About This Home
This home is located at 13051 Orange Ave, Chino, CA 91710 and is currently estimated at $750,444, approximately $507 per square foot. 13051 Orange Ave is a home located in San Bernardino County with nearby schools including Howard Cattle Elementary, Magnolia Junior High, and Chino High School.
Ownership History
Date
Name
Owned For
Owner Type
Purchase Details
Closed on
Oct 5, 2022
Sold by
Rodriguez Cameron
Bought by
Paolino Lauren
Current Estimated Value
Purchase Details
Closed on
Sep 22, 2022
Sold by
Lemento Samuel Joseph and Lemento Annmarie Michael
Bought by
Lemento Samuel Joseph and Lemento Annmarie Michaeleen
Purchase Details
Closed on
Apr 20, 2014
Sold by
Lemento Annmarie and Paolino Annmarie
Bought by
Lemento Samuel Joseph and Lemento Annmarie Michaeleen
Purchase Details
Closed on
Nov 29, 2010
Sold by
Paolino John V
Bought by
Paolino Annmarie M
Purchase Details
Closed on
Sep 2, 1993
Sold by
Morell Patrick
Bought by
Paolino John V and Paolino Annmarie M
Home Financials for this Owner
Home Financials are based on the most recent Mortgage that was taken out on this home.
Original Mortgage
$165,836
Interest Rate
7.25%
Mortgage Type
Seller Take Back
Create a Home Valuation Report for This Property
The Home Valuation Report is an in-depth analysis detailing your home's value as well as a comparison with similar homes in the area
Home Values in the Area
Average Home Value in this Area
Purchase History
| Date | Buyer | Sale Price | Title Company |
|---|---|---|---|
| Paolino Lauren | -- | Fidelity National Title | |
| Lemento Samuel Joseph | -- | Fidelity National Title | |
| Lemento Samuel Joseph | -- | None Available | |
| Paolino Annmarie M | -- | Fidelity-Riverside | |
| Paolino John V | $166,000 | -- |
Source: Public Records
Mortgage History
| Date | Status | Borrower | Loan Amount |
|---|---|---|---|
| Previous Owner | Paolino John V | $165,836 |
Source: Public Records
Tax History
| Year | Tax Paid | Tax Assessment Tax Assessment Total Assessment is a certain percentage of the fair market value that is determined by local assessors to be the total taxable value of land and additions on the property. | Land | Improvement |
|---|---|---|---|---|
| 2025 | $3,616 | $321,523 | $70,536 | $250,987 |
| 2024 | $3,520 | $315,219 | $69,153 | $246,066 |
| 2023 | $3,424 | $309,038 | $67,797 | $241,241 |
| 2022 | $3,404 | $302,979 | $66,468 | $236,511 |
| 2021 | $3,338 | $297,039 | $65,165 | $231,874 |
| 2020 | $3,295 | $293,993 | $64,497 | $229,496 |
| 2019 | $3,238 | $288,228 | $63,232 | $224,996 |
| 2018 | $3,167 | $282,576 | $61,992 | $220,584 |
| 2017 | $3,111 | $277,035 | $60,776 | $216,259 |
| 2016 | $2,909 | $271,603 | $59,584 | $212,019 |
| 2015 | $3,721 | $267,523 | $58,689 | $208,834 |
| 2014 | $2,795 | $262,282 | $57,539 | $204,743 |
Source: Public Records
Map
Nearby Homes
- 12997 Falcon Place
- 13035 Arlington Ln
- 6756 Summerfield Ct
- 6766 Foxcroft Ct
- 12834 Zinnea Ave
- 13284 Cypress Ave
- 12837 Sunrose Ct
- 12804 Somerset Place
- 12737 Carob Ct
- 14000 San Antonio Ave
- 13266 Murano Ave Unit 19
- 13462 Mashona Ave
- 2819 S Euclid Ave
- 6057 Barbara St
- 125 E Saint Andrews St
- 6703 Poinsettia Ct
- 12482 Silkleaf Ave
- 320 W Walnut St Unit 51
- 5963 Rosario St
- 4602 Granville Ct
- 13041 Orange Ave
- 13061 Orange Ave
- 13062 Chukar Ct
- 13070 Chukar Ct
- 13052 Chukar Ct
- 13031 Orange Ave
- 13081 Orange Ave
- 13050 Orange Ave
- 13066 Orange Ave
- 13042 Chukar Ct
- 13082 Chukar Ct
- 13036 Orange Ave
- 13080 Orange Ave
- 13015 Orange Ave
- 13032 Chukar Ct
- 13020 Orange Ave
- 13067 Chukar Ct
- 13057 Robin Ln
- 13047 Robin Ln
- 13055 Chukar Ct
Your Personal Tour Guide
Ask me questions while you tour the home.