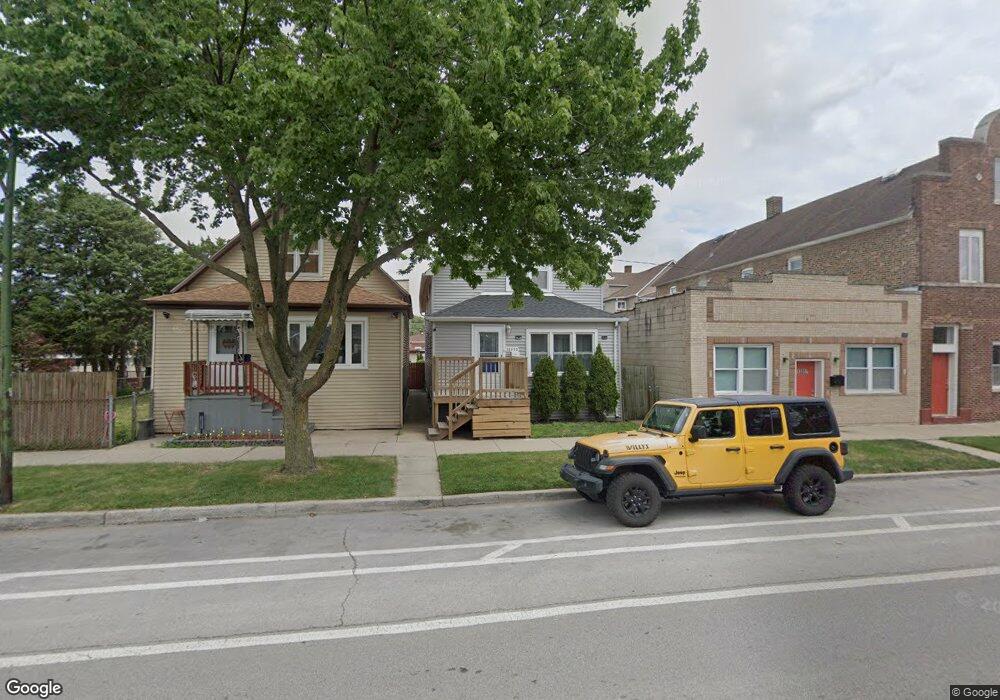
13053 S Baltimore Ave Chicago, IL 60633
Hegewisch NeighborhoodEstimated Value: $92,000 - $244,000
5
Beds
2
Baths
1,728
Sq Ft
$110/Sq Ft
Est. Value
About This Home
This home is located at 13053 S Baltimore Ave, Chicago, IL 60633 and is currently estimated at $189,380, approximately $109 per square foot. 13053 S Baltimore Ave is a home located in Cook County with nearby schools including Henry Clay Elementary School, George Washington High School, and St Casimir School.
Ownership History
Date
Name
Owned For
Owner Type
Purchase Details
Closed on
May 22, 2013
Sold by
Lopez Antonio and Lopez Guadalupe
Bought by
Huizar Beatriz C
Current Estimated Value
Home Financials for this Owner
Home Financials are based on the most recent Mortgage that was taken out on this home.
Original Mortgage
$42,750
Outstanding Balance
$30,157
Interest Rate
3.38%
Mortgage Type
New Conventional
Estimated Equity
$159,223
Purchase Details
Closed on
May 22, 2003
Sold by
Wontor Elizabeth M and Bradtke Betty Ann
Bought by
Lopez Antonio and Lopez Maria C
Home Financials for this Owner
Home Financials are based on the most recent Mortgage that was taken out on this home.
Original Mortgage
$126,900
Interest Rate
5.97%
Mortgage Type
Unknown
Purchase Details
Closed on
Apr 2, 2001
Sold by
Sakich Mary Ann and Sakich Frank
Bought by
Wontor Elizabeth M and Bradtke Betty Ann
Purchase Details
Closed on
Oct 21, 1994
Sold by
Wontor Elizabeth M
Bought by
Wontor Elizabeth M and Sakich Maryann
Create a Home Valuation Report for This Property
The Home Valuation Report is an in-depth analysis detailing your home's value as well as a comparison with similar homes in the area
Home Values in the Area
Average Home Value in this Area
Purchase History
| Date | Buyer | Sale Price | Title Company |
|---|---|---|---|
| Huizar Beatriz C | $45,000 | Fidelity National Title | |
| Lopez Antonio | $127,000 | Pntn | |
| Wontor Elizabeth M | -- | -- | |
| Wontor Elizabeth M | -- | -- |
Source: Public Records
Mortgage History
| Date | Status | Borrower | Loan Amount |
|---|---|---|---|
| Open | Huizar Beatriz C | $42,750 | |
| Previous Owner | Lopez Antonio | $126,900 |
Source: Public Records
Tax History Compared to Growth
Tax History
| Year | Tax Paid | Tax Assessment Tax Assessment Total Assessment is a certain percentage of the fair market value that is determined by local assessors to be the total taxable value of land and additions on the property. | Land | Improvement |
|---|---|---|---|---|
| 2024 | $1,625 | $11,300 | $1,250 | $10,050 |
| 2023 | $1,564 | $11,000 | $3,125 | $7,875 |
| 2022 | $1,564 | $11,000 | $3,125 | $7,875 |
| 2021 | $1,547 | $11,000 | $3,125 | $7,875 |
| 2020 | $2,093 | $12,474 | $2,031 | $10,443 |
| 2019 | $2,101 | $13,861 | $2,031 | $11,830 |
| 2018 | $2,065 | $13,861 | $2,031 | $11,830 |
| 2017 | $2,597 | $15,412 | $1,875 | $13,537 |
| 2016 | $2,593 | $15,412 | $1,875 | $13,537 |
| 2015 | $2,349 | $15,412 | $1,875 | $13,537 |
| 2014 | $2,028 | $13,469 | $1,562 | $11,907 |
| 2013 | $1,976 | $13,469 | $1,562 | $11,907 |
Source: Public Records
Map
Nearby Homes
- 13147 S Brandon Ave
- 13118 S Buffalo Ave
- 13431 S Houston Ave
- 12915 S Houston Ave
- 13228 S Houston Ave
- 12901 S Carondolet Ave
- 13258 S Houston Ave
- 12949 S Exchange Ave
- 13248 S Carondolet Ave
- 13304 S Burley Ave
- 13115 S Escanaba Ave
- 13331 S Houston Ave
- 13334 S Houston Ave
- 13122 S Escanaba Ave
- 13351 S Baltimore Ave
- 13041 S Muskegon Ave
- 13121 S Muskegon Ave
- 13015 S Muskegon Ave
- 13346 S Carondolet Ave
- 13310 S Avenue O
- 13051 S Baltimore Ave
- 13057 S Baltimore Ave
- 13059 S Baltimore Ave
- 13045 S Baltimore Ave
- 13043 S Baltimore Ave
- 13052 S Brandon Ave
- 13056 S Brandon Ave
- 13048 S Brandon Ave
- 13058 S Brandon Ave
- 13039 S Baltimore Ave
- 13046 S Brandon Ave
- 13054 S Baltimore Ave
- 13042 S Brandon Ave
- 13040 S Brandon Ave
- 13056 S Baltimore Ave
- 13035 S Baltimore Ave
- 13038 S Brandon Ave
- 13033 S Baltimore Ave
- 13052 S Baltimore Ave
- 13100 S Brandon Ave