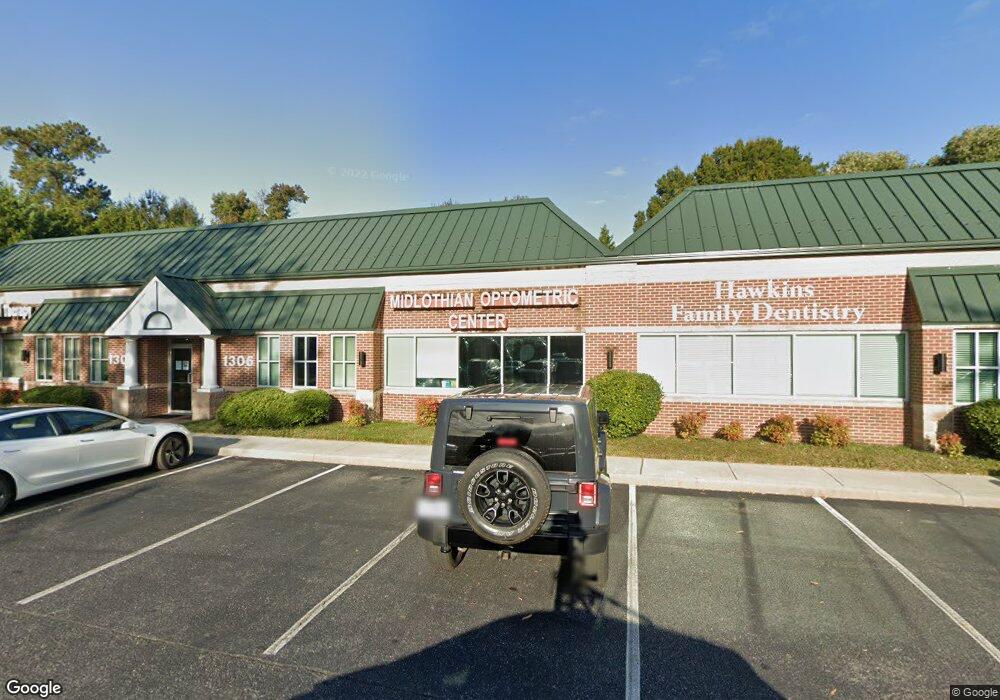
1306 Alverser Plaza Midlothian, VA 23113
Bon Air NeighborhoodEstimated Value: $1,084,782
--
Bed
--
Bath
3,480
Sq Ft
$312/Sq Ft
Est. Value
About This Home
This home is located at 1306 Alverser Plaza, Midlothian, VA 23113 and is currently estimated at $1,084,782, approximately $311 per square foot. 1306 Alverser Plaza is a home located in Chesterfield County with nearby schools including Robious Elementary School, Robious Middle School, and James River High School.
Ownership History
Date
Name
Owned For
Owner Type
Purchase Details
Closed on
Aug 15, 2017
Sold by
Rosen Luis Am
Bought by
Jna Property Llc A Virginia Limited Liab
Current Estimated Value
Home Financials for this Owner
Home Financials are based on the most recent Mortgage that was taken out on this home.
Original Mortgage
$561,000
Outstanding Balance
$468,992
Interest Rate
4.03%
Mortgage Type
Commercial
Estimated Equity
$615,790
Purchase Details
Closed on
Apr 24, 2007
Sold by
Medicorp Llc
Bought by
Rosen Jordan
Home Financials for this Owner
Home Financials are based on the most recent Mortgage that was taken out on this home.
Original Mortgage
$604,000
Interest Rate
6.18%
Mortgage Type
Commercial
Purchase Details
Closed on
Nov 22, 2002
Sold by
Specialty Design
Bought by
Medicorp Ii Llc
Home Financials for this Owner
Home Financials are based on the most recent Mortgage that was taken out on this home.
Original Mortgage
$430,000
Interest Rate
6.07%
Mortgage Type
New Conventional
Create a Home Valuation Report for This Property
The Home Valuation Report is an in-depth analysis detailing your home's value as well as a comparison with similar homes in the area
Home Values in the Area
Average Home Value in this Area
Purchase History
| Date | Buyer | Sale Price | Title Company |
|---|---|---|---|
| Jna Property Llc A Virginia Limited Liab | $660,000 | Attorney | |
| Rosen Jordan | $725,000 | -- | |
| Medicorp Ii Llc | $394,335 | -- |
Source: Public Records
Mortgage History
| Date | Status | Borrower | Loan Amount |
|---|---|---|---|
| Open | Jna Property Llc A Virginia Limited Liab | $561,000 | |
| Previous Owner | Rosen Jordan | $604,000 | |
| Previous Owner | Medicorp Ii Llc | $430,000 |
Source: Public Records
Tax History Compared to Growth
Tax History
| Year | Tax Paid | Tax Assessment Tax Assessment Total Assessment is a certain percentage of the fair market value that is determined by local assessors to be the total taxable value of land and additions on the property. | Land | Improvement |
|---|---|---|---|---|
| 2025 | $6,367 | $694,200 | $74,400 | $619,800 |
| 2024 | $6,367 | $674,000 | $74,400 | $599,600 |
| 2023 | $5,749 | $631,800 | $74,400 | $557,400 |
| 2022 | $6,233 | $677,500 | $58,400 | $619,100 |
| 2021 | $6,622 | $677,500 | $58,400 | $619,100 |
| 2020 | $6,436 | $677,500 | $58,400 | $619,100 |
| 2019 | $6,240 | $656,800 | $57,200 | $599,600 |
| 2018 | $6,240 | $656,800 | $57,200 | $599,600 |
| 2017 | $6,305 | $656,800 | $57,200 | $599,600 |
| 2016 | $6,437 | $656,800 | $57,200 | $599,600 |
| 2015 | -- | $656,800 | $57,200 | $599,600 |
| 2014 | -- | $656,800 | $57,200 | $599,600 |
Source: Public Records
Map
Nearby Homes
- 11617 Olde Coach Dr
- 1516 Sandgate Rd
- 1221 Warminster Dr
- 1660 Sandgate Rd
- 11601 Featherstone Ct
- 1040 Black Heath Rd
- 12260 Haydon Place
- 11911 Kilrenny Rd
- 11913 W Briar Patch Dr
- 12233 Haydon Place
- 11709 S Briar Patch Dr
- 11714 S Briar Patch Dr
- 11627 E Briar Patch Dr
- 11814 N Briar Patch Dr
- 11753 N Briar Patch Dr
- 11602 E Briar Patch Dr
- 701 N Courthouse Rd
- 645 Farnham Cir
- 12406 Carnoustie Ln Unit B
- 11151 Research Plaza Way
- 1310 Alverser Plaza
- 1316 Alverser Plaza
- 1300 Alverser Plaza
- 1320 Alverser Plaza
- 11800 Old Buckingham Rd
- 1326 Alverser Plaza
- 1330 Alverser Plaza
- 1413 Camberly Ct
- 1419 Camberly Ct
- 1336 Alverser Plaza
- 1401 Camberly Ct
- 1340 Alverser Plaza
- 1425 Camberly Ct
- 1400 Tannery Cir
- 1402 Tannery Cir
- 1260 Alverser Plaza
- 0 Camberly Ct
- 000 Camberly Ct
- 00 Camberly Ct
- 4 Camberly Ct