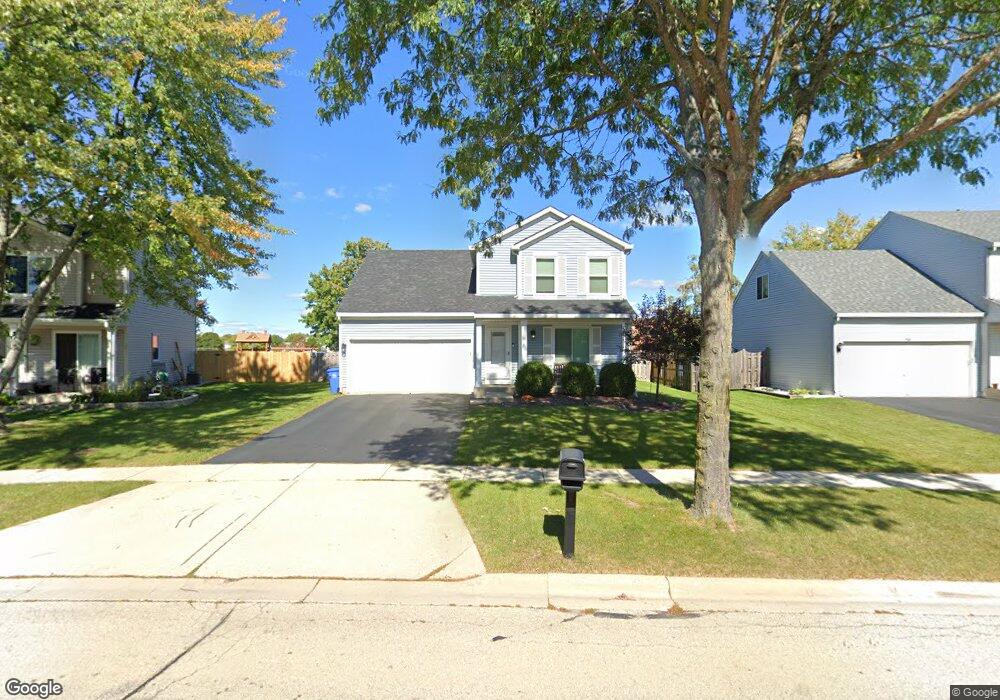
1306 Burke Ln South Elgin, IL 60177
Estimated Value: $375,000 - $396,000
4
Beds
2
Baths
1,734
Sq Ft
$223/Sq Ft
Est. Value
About This Home
This home is located at 1306 Burke Ln, South Elgin, IL 60177 and is currently estimated at $386,128, approximately $222 per square foot. 1306 Burke Ln is a home located in Kane County with nearby schools including Fox Meadow Elementary School, Kenyon Woods Middle School, and South Elgin High School.
Ownership History
Date
Name
Owned For
Owner Type
Purchase Details
Closed on
Sep 29, 2000
Sold by
Crites Ralph E
Bought by
Gainer Robert A and Gainer Toni L
Current Estimated Value
Home Financials for this Owner
Home Financials are based on the most recent Mortgage that was taken out on this home.
Original Mortgage
$153,375
Outstanding Balance
$56,214
Interest Rate
7.99%
Mortgage Type
FHA
Estimated Equity
$329,914
Purchase Details
Closed on
Mar 9, 1999
Sold by
Hud
Bought by
Crites Ralph E
Home Financials for this Owner
Home Financials are based on the most recent Mortgage that was taken out on this home.
Original Mortgage
$122,021
Interest Rate
9.4%
Purchase Details
Closed on
Oct 16, 1998
Sold by
Kosek Thomas G and Kosek Diana L
Bought by
Hud
Purchase Details
Closed on
Feb 20, 1997
Sold by
Sundance Holdings Inc
Bought by
Kosek Thomas G and Kosek Diana L
Home Financials for this Owner
Home Financials are based on the most recent Mortgage that was taken out on this home.
Original Mortgage
$152,352
Interest Rate
7.93%
Mortgage Type
FHA
Create a Home Valuation Report for This Property
The Home Valuation Report is an in-depth analysis detailing your home's value as well as a comparison with similar homes in the area
Home Values in the Area
Average Home Value in this Area
Purchase History
| Date | Buyer | Sale Price | Title Company |
|---|---|---|---|
| Gainer Robert A | $170,000 | -- | |
| Crites Ralph E | -- | Stewart Title | |
| Hud | -- | Wheatland Title | |
| Kosek Thomas G | $156,000 | Ticor Title Insurance |
Source: Public Records
Mortgage History
| Date | Status | Borrower | Loan Amount |
|---|---|---|---|
| Open | Gainer Robert A | $153,375 | |
| Previous Owner | Crites Ralph E | $122,021 | |
| Previous Owner | Kosek Thomas G | $152,352 |
Source: Public Records
Tax History Compared to Growth
Tax History
| Year | Tax Paid | Tax Assessment Tax Assessment Total Assessment is a certain percentage of the fair market value that is determined by local assessors to be the total taxable value of land and additions on the property. | Land | Improvement |
|---|---|---|---|---|
| 2024 | $8,287 | $113,019 | $28,317 | $84,702 |
| 2023 | $7,895 | $102,104 | $25,582 | $76,522 |
| 2022 | $7,495 | $93,101 | $23,326 | $69,775 |
| 2021 | $7,058 | $87,043 | $21,808 | $65,235 |
| 2020 | $6,845 | $83,096 | $20,819 | $62,277 |
| 2019 | $6,592 | $79,154 | $19,831 | $59,323 |
| 2018 | $6,463 | $74,568 | $18,682 | $55,886 |
| 2017 | $6,141 | $70,493 | $17,661 | $52,832 |
| 2016 | $5,847 | $65,399 | $16,385 | $49,014 |
| 2015 | -- | $59,944 | $15,018 | $44,926 |
| 2014 | -- | $55,569 | $14,833 | $40,736 |
| 2013 | -- | $57,035 | $15,224 | $41,811 |
Source: Public Records
Map
Nearby Homes
- 1370 Marleigh Ln
- 1236 Sandhurst Ln Unit 4
- 435 Sandhurst Ln Unit 3
- 671 Fieldcrest Dr
- 590 Fenwick Ln
- 1063 Manchester Ct Unit 1
- 387 S Pointe Ave
- 1458 Woodland Dr
- 25 Kingsport Ct
- 962 Ascot Dr
- 8N594 S Mclean Blvd
- 773 Michigan Ave
- 2300 Vineyard Ct
- 1419 S Pembroke Dr
- 962 Annandale Dr
- 2359 Nantucket Ln Unit 9
- 126 Kingsport Dr
- 1705 College Green Dr Unit 2
- 1091 Delta Dr Unit 305E
- 291 Kingsport Dr