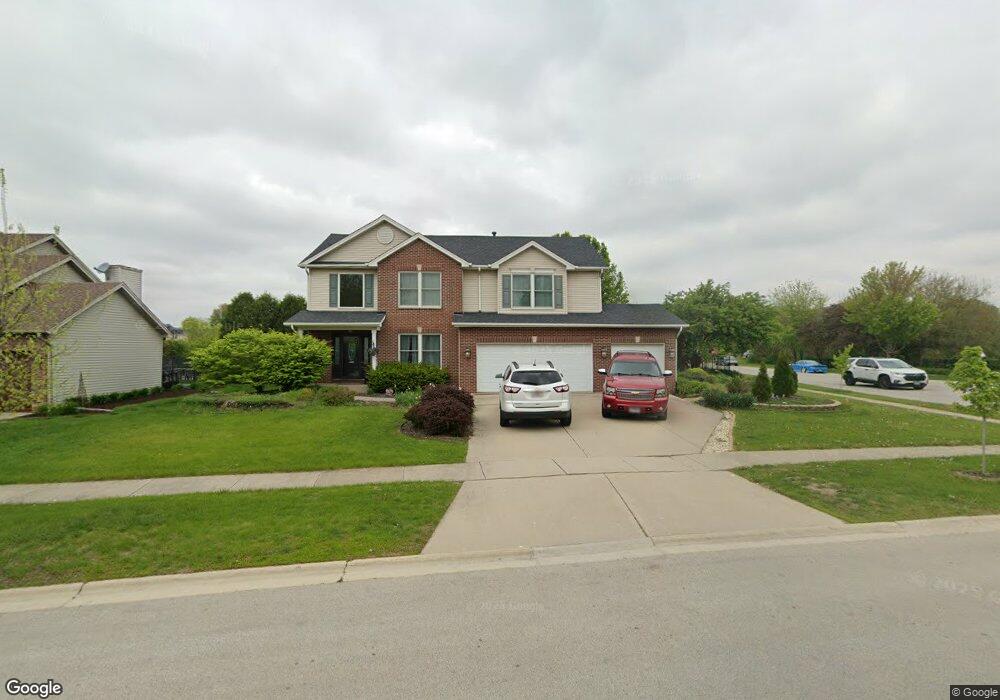
1306 Callaway Dr N Shorewood, IL 60404
Estimated Value: $428,000 - $464,741
4
Beds
4
Baths
2,800
Sq Ft
$161/Sq Ft
Est. Value
About This Home
This home is located at 1306 Callaway Dr N, Shorewood, IL 60404 and is currently estimated at $449,435, approximately $160 per square foot. 1306 Callaway Dr N is a home located in Will County with nearby schools including Walnut Trails Elementary School, Minooka Junior High School, and Minooka Intermediate School.
Ownership History
Date
Name
Owned For
Owner Type
Purchase Details
Closed on
Jun 24, 2024
Sold by
Fick Brandt and Bellia Shari
Bought by
Groth Matthew A and Groth June Grace
Current Estimated Value
Home Financials for this Owner
Home Financials are based on the most recent Mortgage that was taken out on this home.
Original Mortgage
$420,000
Outstanding Balance
$414,650
Interest Rate
7.03%
Mortgage Type
VA
Estimated Equity
$34,785
Purchase Details
Closed on
Dec 22, 2016
Sold by
Fick Brandt
Bought by
Fick Brandt and Bellia Shari
Home Financials for this Owner
Home Financials are based on the most recent Mortgage that was taken out on this home.
Original Mortgage
$315,065
Interest Rate
3.87%
Mortgage Type
VA
Purchase Details
Closed on
Jun 18, 2012
Sold by
Kelly Kevin G
Bought by
Fick Brandt
Home Financials for this Owner
Home Financials are based on the most recent Mortgage that was taken out on this home.
Original Mortgage
$254,125
Interest Rate
3.83%
Mortgage Type
New Conventional
Create a Home Valuation Report for This Property
The Home Valuation Report is an in-depth analysis detailing your home's value as well as a comparison with similar homes in the area
Home Values in the Area
Average Home Value in this Area
Purchase History
| Date | Buyer | Sale Price | Title Company |
|---|---|---|---|
| Groth Matthew A | $420,000 | First American Title | |
| Fick Brandt | -- | Attorney | |
| Fick Brandt | $267,500 | Fidelity National Title |
Source: Public Records
Mortgage History
| Date | Status | Borrower | Loan Amount |
|---|---|---|---|
| Open | Groth Matthew A | $420,000 | |
| Previous Owner | Fick Brandt | $315,065 | |
| Previous Owner | Fick Brandt | $254,125 |
Source: Public Records
Tax History Compared to Growth
Tax History
| Year | Tax Paid | Tax Assessment Tax Assessment Total Assessment is a certain percentage of the fair market value that is determined by local assessors to be the total taxable value of land and additions on the property. | Land | Improvement |
|---|---|---|---|---|
| 2024 | $4,488 | $125,915 | $25,157 | $100,758 |
| 2023 | $4,488 | $113,131 | $22,603 | $90,528 |
| 2022 | $8,188 | $107,050 | $21,388 | $85,662 |
| 2021 | $7,426 | $100,705 | $20,120 | $80,585 |
| 2020 | $7,543 | $100,705 | $20,120 | $80,585 |
| 2019 | $7,393 | $96,600 | $19,300 | $77,300 |
| 2018 | $6,829 | $88,600 | $19,300 | $69,300 |
| 2017 | $6,533 | $83,950 | $19,300 | $64,650 |
| 2016 | $6,324 | $80,250 | $19,300 | $60,950 |
| 2015 | $5,530 | $77,273 | $17,623 | $59,650 |
| 2014 | $5,530 | $72,391 | $17,623 | $54,768 |
| 2013 | $5,530 | $72,391 | $17,623 | $54,768 |
Source: Public Records
Map
Nearby Homes
- 1018 Butterfield Cir E Unit 5
- 22020 S River Rd
- 0000 W Seil Rd
- 25028 Old Oak Ln
- 1602 Fieldstone Dr S
- 25102 Old Oak Ln
- 1604 Augusta Ln
- 25143 W Glen Oaks Ln
- 1713 Fieldstone Dr N
- 25226 Balmoral Dr
- 704 Flag Dr
- 24620 River Crossing Dr
- 20941 Lee St
- 21053 Benjamin Dr
- 21350 S Forest View Dr
- 24539 Bantry Dr
- 2057 Isabella Ln
- 2031 Isabell Ln Unit 1
- 2037 Isabell Ln
- 2048 Isabella Ln
- 1306 Callaway Dr N
- 1304 Callaway Dr N
- 1310 Callaway Dr N
- 1121 Callaway Dr N
- 1309 Callaway Dr N Unit 1
- 1311 Callaway Dr N Unit 1
- 1302 Callaway Dr N
- 1307 Callaway Dr N
- 1313 Callaway Dr N
- 1312 Callaway Dr N
- 1305 Callaway Dr N
- 813 Diamond Head Dr E
- 900 Callaway Dr W
- 902 Diamond Head Dr E
- 1314 Callaway Dr N Unit 1
- 1303 Callaway Dr N Unit 1
- 1004 Conrad Ln Unit 4
- 811 Diamond Head Dr E
- 1006 Conrad Ln Unit 4
- 902 Callaway Dr W