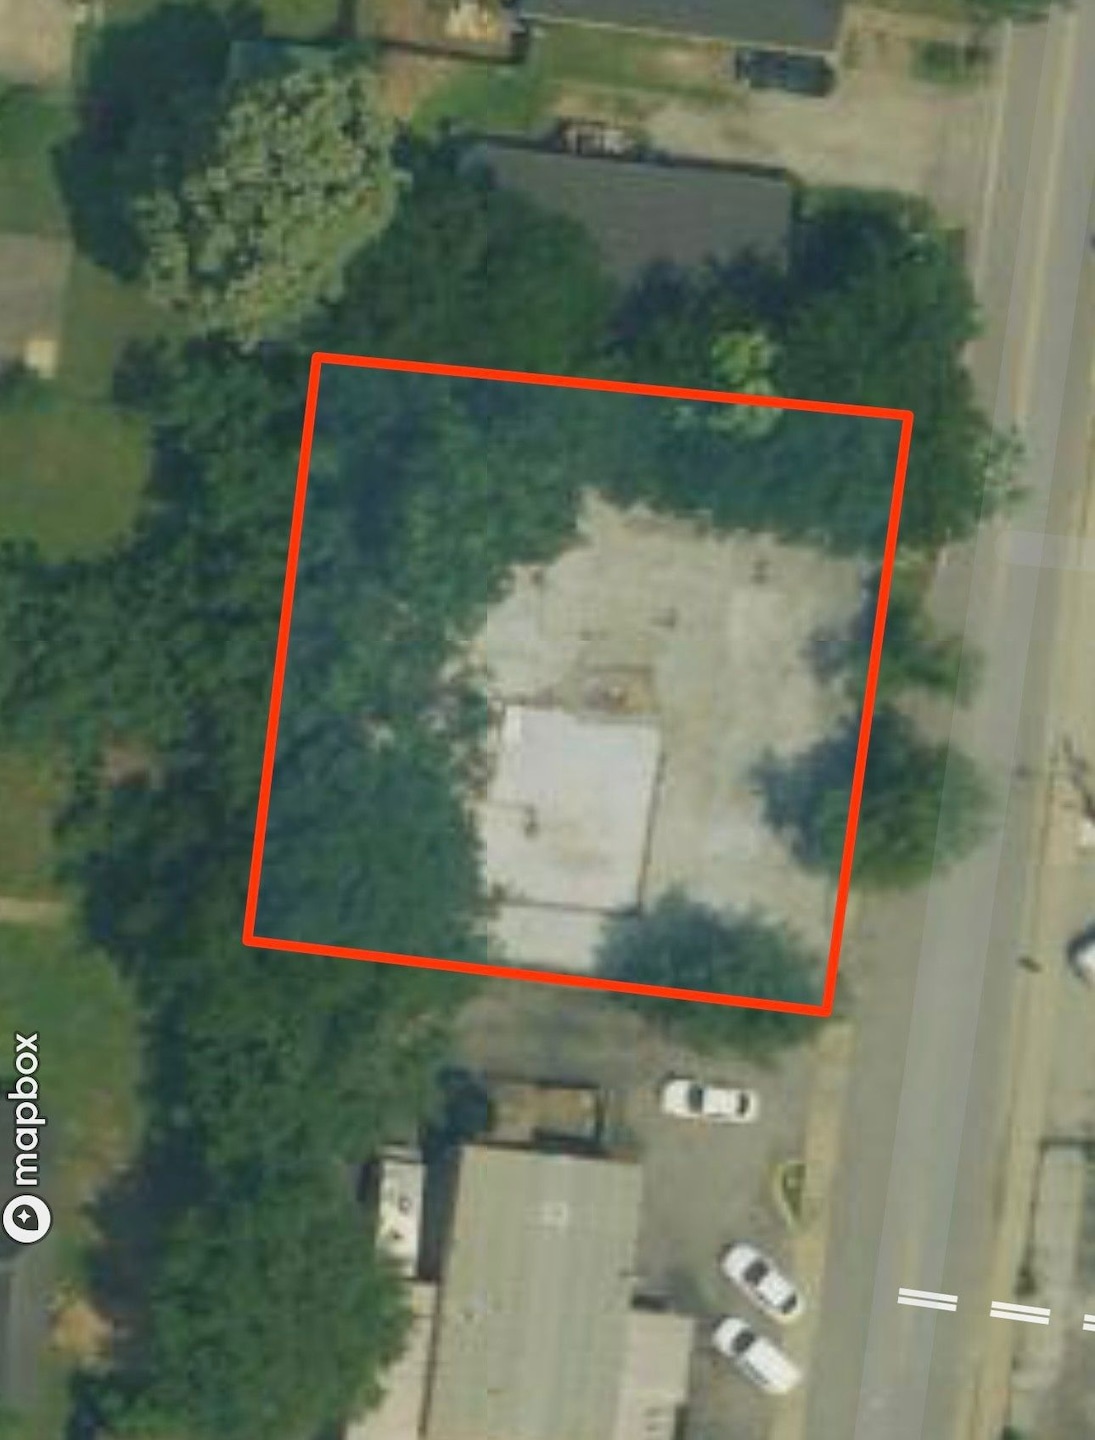
1306 Jones Ave Nashville, TN 37207
Talbot's Corner NeighborhoodEstimated payment $2,096/month
Total Views
3,181
0.11
Acre
$3,500,000
Price per Acre
4,792
Sq Ft Lot
About This Lot
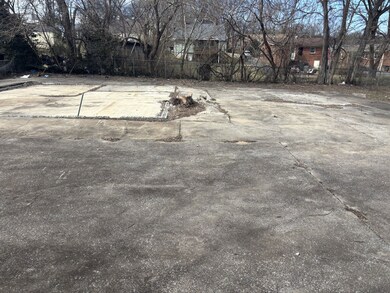
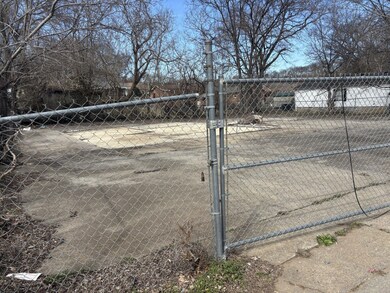
This fenced lot is in the super desirable East Nashville area. There is also an identical lot next door for sale by same owner 1304 Jones. There is an alley in the back for access as well. I sold the corner across the road and a large multifamily building is going up as I type. Lots are vacant. We did the demo thru Metro this past year.
Listing Agent
Wally Jr
Wally Gilliam Realty & Auction Listed on: 11/17/2025
Listing Provided By

Property Details
Property Type
- Land
Est. Annual Taxes
- $809
Lot Details
- Property fronts an alley
- Current uses include residential multi-family, residential single
- Potential uses include residential multi-family, residential single
Map
Create a Home Valuation Report for This Property
The Home Valuation Report is an in-depth analysis detailing your home's value as well as a comparison with similar homes in the area
Home Values in the Area
Average Home Value in this Area
Tax History
| Year | Tax Paid | Tax Assessment Tax Assessment Total Assessment is a certain percentage of the fair market value that is determined by local assessors to be the total taxable value of land and additions on the property. | Land | Improvement |
|---|---|---|---|---|
| 2024 | $809 | $24,875 | $24,875 | $0 |
| 2023 | $809 | $24,875 | $24,875 | $0 |
| 2022 | $809 | $24,875 | $24,875 | $0 |
| 2021 | $818 | $24,875 | $24,875 | $0 |
| 2020 | $718 | $17,000 | $17,000 | $0 |
| 2019 | $536 | $17,000 | $17,000 | $0 |
| 2018 | $536 | $17,000 | $17,000 | $0 |
| 2017 | $536 | $17,000 | $17,000 | $0 |
| 2016 | $169 | $3,750 | $3,750 | $0 |
| 2015 | $169 | $3,750 | $3,750 | $0 |
| 2014 | $169 | $3,750 | $3,750 | $0 |
Source: Public Records
Property History
| Date | Event | Price | List to Sale | Price per Sq Ft |
|---|---|---|---|---|
| 10/01/2025 10/01/25 | Price Changed | $385,000 | 0.0% | -- |
| 10/01/2025 10/01/25 | For Sale | $385,000 | -3.8% | -- |
| 10/01/2025 10/01/25 | Off Market | $400,000 | -- | -- |
| 04/18/2025 04/18/25 | Price Changed | $400,000 | -5.9% | -- |
| 03/18/2025 03/18/25 | For Sale | $425,000 | -- | -- |
Nearby Homes
- 1304 Jones Ave
- 505 Wesley Ave
- 2101 Jones Cir
- 520 Norton Ave
- 435 E Trinity Ln
- 433 E Trinity Ln
- 428 E Trinity Ln Unit D
- 428 E Trinity Ln Unit B
- 532 Wesley Ave
- 31 Gerald St
- 310 Prince Ave Unit A
- Camden Plan at Highland Gardens
- 504 Edwin St Unit 1
- 504 Edwin St Unit 29
- The Sutton Plan at Highland Gardens
- 504 Edwin St Unit 22
- 504 Edwin St Unit 27
- 504 Edwin St
- 504 Edwin St Unit 41
- 504 Edwin St Unit 42
- 338 Duke St
- 2005 Overby Rd Unit A
- 2005 Overby Rd Unit B
- 524 Norton Ave
- 2502 Woodyhill Dr
- 532 Norton Ave
- 142 Gordon Terrace Unit b
- 308 Prince Ave Unit B
- 308 Prince Ave Unit C
- 308 Prince Ave Unit D
- 2085 Oakwood Ave
- 530 Edwin St Unit 5
- 2600 Jones Ave
- 212 Queen Ave
- 1526 Jones Ave
- 219C Prince Ave
- 1806 Lischey Ave Unit 7
- 1806 Lischey Ave Unit 8
- 1806 Lischey Ave Unit 2
- 1701 Lischey Ave