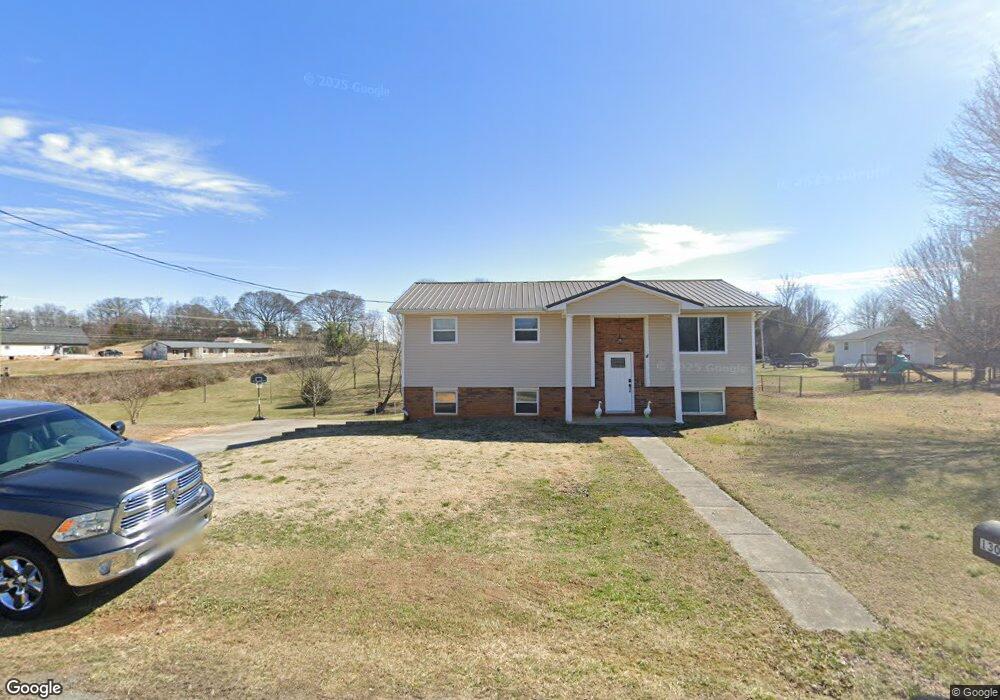
1306 Summer Ln Jefferson City, TN 37760
Estimated Value: $237,281 - $333,000
3
Beds
1
Bath
1,464
Sq Ft
$200/Sq Ft
Est. Value
About This Home
This home is located at 1306 Summer Ln, Jefferson City, TN 37760 and is currently estimated at $293,070, approximately $200 per square foot. 1306 Summer Ln is a home located in Jefferson County.
Ownership History
Date
Name
Owned For
Owner Type
Purchase Details
Closed on
Feb 28, 2022
Sold by
Elizabeth Cline Marlene
Bought by
Wood Dennis V and Wood Stacy M
Current Estimated Value
Purchase Details
Closed on
Sep 30, 2008
Sold by
Cameron Michael S
Bought by
Cline Marlene Elizabeth
Home Financials for this Owner
Home Financials are based on the most recent Mortgage that was taken out on this home.
Original Mortgage
$116,956
Interest Rate
6.34%
Purchase Details
Closed on
Mar 31, 1997
Sold by
Neely Thomas W
Bought by
Michael Cameron
Purchase Details
Closed on
Mar 27, 1997
Bought by
Cameron Michael S and Cameron Rebekah
Purchase Details
Closed on
Jun 24, 1994
Bought by
Neely Thomas W and Neely Raquel S
Purchase Details
Closed on
Jan 1, 1984
Bought by
Presley Richard C and Presley Sandra J
Purchase Details
Closed on
Jan 1, 1982
Purchase Details
Closed on
Oct 24, 1979
Purchase Details
Closed on
Jul 14, 1971
Create a Home Valuation Report for This Property
The Home Valuation Report is an in-depth analysis detailing your home's value as well as a comparison with similar homes in the area
Home Values in the Area
Average Home Value in this Area
Purchase History
| Date | Buyer | Sale Price | Title Company |
|---|---|---|---|
| Wood Dennis V | $18,000 | None Listed On Document | |
| Cline Marlene Elizabeth | $118,500 | -- | |
| Michael Cameron | $48,900 | -- | |
| Cameron Michael S | $47,300 | -- | |
| Neely Thomas W | $48,000 | -- | |
| Presley Richard C | $40,000 | -- | |
| -- | $39,500 | -- | |
| -- | -- | -- | |
| -- | -- | -- |
Source: Public Records
Mortgage History
| Date | Status | Borrower | Loan Amount |
|---|---|---|---|
| Previous Owner | Not Available | $116,956 |
Source: Public Records
Tax History Compared to Growth
Tax History
| Year | Tax Paid | Tax Assessment Tax Assessment Total Assessment is a certain percentage of the fair market value that is determined by local assessors to be the total taxable value of land and additions on the property. | Land | Improvement |
|---|---|---|---|---|
| 2025 | $667 | $46,625 | $8,500 | $38,125 |
| 2023 | $320 | $13,900 | $0 | $0 |
| 2022 | $304 | $13,900 | $5,250 | $8,650 |
| 2021 | $525 | $23,950 | $5,250 | $18,700 |
| 2020 | $525 | $23,950 | $5,250 | $18,700 |
| 2019 | $525 | $23,950 | $5,250 | $18,700 |
| 2018 | $508 | $21,625 | $5,000 | $16,625 |
| 2017 | $508 | $21,625 | $5,000 | $16,625 |
| 2016 | $508 | $21,625 | $5,000 | $16,625 |
| 2015 | $508 | $21,625 | $5,000 | $16,625 |
| 2014 | $508 | $21,625 | $5,000 | $16,625 |
Source: Public Records
Map
Nearby Homes
- 1336 Tom Breeden Rd
- 144 Snowbird Ln Unit 13
- 144 Snowbird Ln
- Lot 18 Kaylee Dr
- 1946 Kaylee Dr
- 1961 Kaylee Dr
- 1991 Kaylee Dr
- 1601 Mossy Oak Dr
- 1001 Dumplin Valley Rd E
- 664 Oxford Rd
- Parcel 086 N Chucky Pike
- 846 N Chucky Pike
- 747 E Dumplin Valley Rd
- 1211 Debrex Dr
- Lot 0 Talbott-Kansas Rd
- 1202 Deer Ln
- 2013 Phagan Rd
- 508 Cannon Rd
- 230 Fieldcrest Dr
- 1308 Summer Ln
- 936 Preston Rd
- 1302 Summer Ln
- 1305 Summer Ln
- 1307 Summer Ln
- 1309 Summer Ln
- 940 Preston Rd
- 427 N Chucky Pike
- 929 Preston Rd
- 939 Preston Rd Unit S/D CHUCKY ESTATES
- 939 Preston Rd
- 923 Preston Rd
- 397 N Chucky Pike
- 918 Preston Rd
- 420 N Chucky Pike
- 919 Preston Rd
- 431 N Chucky Pike
- 910 Preston Rd
- 915 Preston Rd
- 1302 Tom Breeden Rd