Estimated Value: $155,000 - $173,000
3
Beds
2
Baths
960
Sq Ft
$172/Sq Ft
Est. Value
About This Home
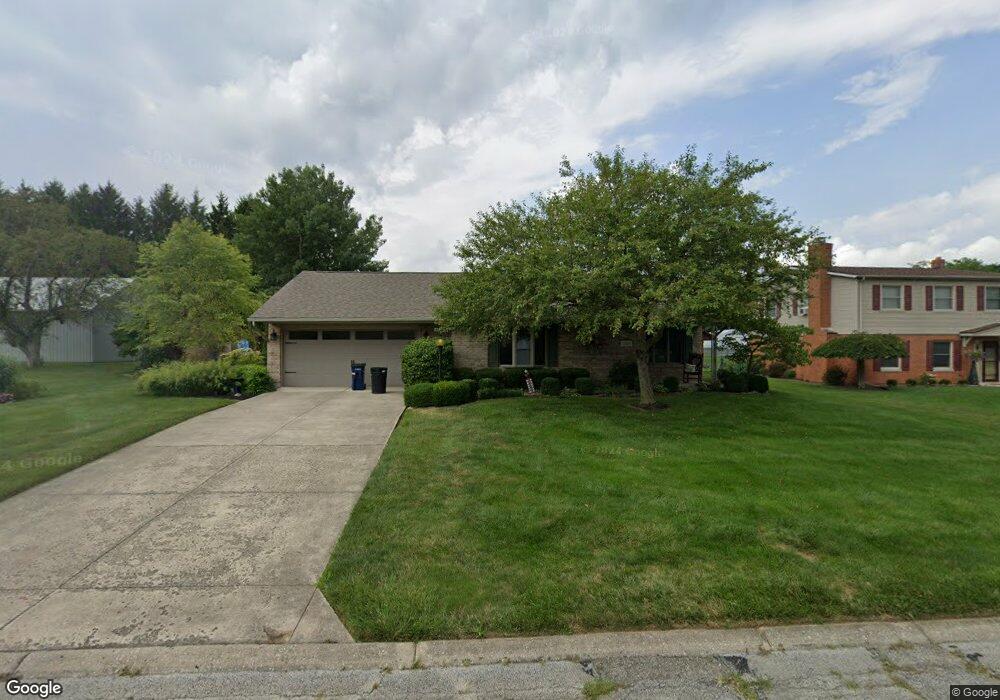
This home is located at 1306 W High St, Piqua, OH 45356 and is currently estimated at $165,050, approximately $171 per square foot. 1306 W High St is a home located in Miami County with nearby schools including Washington Primary School, Piqua Junior High School, and Piqua High School.
Ownership History
Date
Name
Owned For
Owner Type
Purchase Details
Closed on
Apr 23, 2021
Sold by
Bolton Jeffrey A
Bought by
Abbott Breanna and Abbott Dawana
Current Estimated Value
Home Financials for this Owner
Home Financials are based on the most recent Mortgage that was taken out on this home.
Original Mortgage
$117,826
Outstanding Balance
$106,468
Interest Rate
3.05%
Mortgage Type
FHA
Estimated Equity
$58,582
Purchase Details
Closed on
Sep 9, 2015
Sold by
Bolton Terry J and Bolton Christine M
Bought by
Bolton Jeffrey A
Purchase Details
Closed on
May 12, 2015
Sold by
Trissell David M and Trissell Jennifer M
Bought by
Bolton Terry J and Bolton Christine M
Purchase Details
Closed on
Dec 8, 1999
Sold by
Meredith Robert W
Bought by
Trissell David M and Trissell Jennifer M
Purchase Details
Closed on
Jan 1, 1985
Bought by
Meredith Robert W
Create a Home Valuation Report for This Property
The Home Valuation Report is an in-depth analysis detailing your home's value as well as a comparison with similar homes in the area
Home Values in the Area
Average Home Value in this Area
Purchase History
| Date | Buyer | Sale Price | Title Company |
|---|---|---|---|
| Abbott Breanna | $120,000 | First American Mortgage Sln | |
| Bolton Jeffrey A | $50,000 | Attorney | |
| Bolton Terry J | $91,000 | Attorney | |
| Trissell David M | $90,000 | -- | |
| Meredith Robert W | -- | -- |
Source: Public Records
Mortgage History
| Date | Status | Borrower | Loan Amount |
|---|---|---|---|
| Open | Abbott Breanna | $117,826 |
Source: Public Records
Tax History Compared to Growth
Tax History
| Year | Tax Paid | Tax Assessment Tax Assessment Total Assessment is a certain percentage of the fair market value that is determined by local assessors to be the total taxable value of land and additions on the property. | Land | Improvement |
|---|---|---|---|---|
| 2024 | $1,574 | $38,290 | $11,200 | $27,090 |
| 2023 | $1,574 | $38,290 | $11,200 | $27,090 |
| 2022 | $1,601 | $38,290 | $11,200 | $27,090 |
| 2021 | $1,326 | $28,360 | $8,300 | $20,060 |
| 2020 | $1,304 | $28,360 | $8,300 | $20,060 |
| 2019 | $1,311 | $28,360 | $8,300 | $20,060 |
| 2018 | $1,203 | $24,820 | $8,300 | $16,520 |
| 2017 | $1,218 | $24,820 | $8,300 | $16,520 |
| 2016 | $1,206 | $24,820 | $8,300 | $16,520 |
| 2015 | $1,199 | $24,820 | $8,300 | $16,520 |
| 2014 | $1,199 | $24,820 | $8,300 | $16,520 |
| 2013 | $1,204 | $24,820 | $8,300 | $16,520 |
Source: Public Records
Map
Nearby Homes
- 1308 W High St
- 220 Lyndhurst Dr
- 1300 W High St
- 1240 Marwood Dr
- 1233 Marwood Dr
- 218 Lyndhurst Dr
- 1313 W High St
- 1256 W High St
- 1238 Marwood Dr
- 219 Lyndhurst Dr
- 1401 W High St
- 216 Lyndhurst Dr
- 1254 W High St
- 217 Lyndhurst Dr
- 1236 Marwood Dr
- 209 Maryville Ln
- 1403 W High St
- 1252 W High St
- 214 Lyndhurst Dr
- 215 Lyndhurst Dr