Estimated Value: $751,000 - $798,000
3
Beds
2
Baths
1,624
Sq Ft
$474/Sq Ft
Est. Value
About This Home
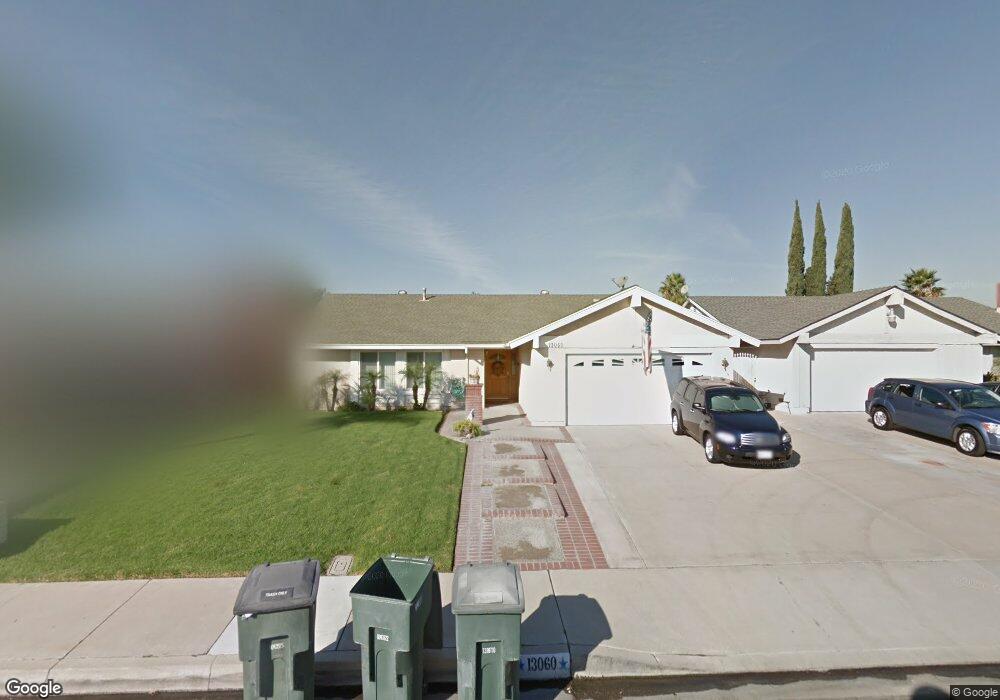
This home is located at 13060 Cypress Ave, Chino, CA 91710 and is currently estimated at $769,595, approximately $473 per square foot. 13060 Cypress Ave is a home located in San Bernardino County with nearby schools including Howard Cattle Elementary, Magnolia Junior High, and Chino High School.
Ownership History
Date
Name
Owned For
Owner Type
Purchase Details
Closed on
Jul 18, 2016
Sold by
Aguilera Joe C and Aguilera Cheryl L
Bought by
Aguilera Joe and Aguilera Cheryl L
Current Estimated Value
Purchase Details
Closed on
Oct 9, 2007
Sold by
Aguilera Joe C and Aguilera Cheryl L
Bought by
Aguilera Cheryl L and Aguilera Joe C
Home Financials for this Owner
Home Financials are based on the most recent Mortgage that was taken out on this home.
Original Mortgage
$270,000
Outstanding Balance
$170,231
Interest Rate
6.4%
Mortgage Type
New Conventional
Estimated Equity
$599,364
Purchase Details
Closed on
Aug 31, 1994
Sold by
Walker Robert L and Walker Jodi C
Bought by
Aguilera Joe C and Aguilera Cheryl L
Home Financials for this Owner
Home Financials are based on the most recent Mortgage that was taken out on this home.
Original Mortgage
$127,350
Interest Rate
8.37%
Create a Home Valuation Report for This Property
The Home Valuation Report is an in-depth analysis detailing your home's value as well as a comparison with similar homes in the area
Home Values in the Area
Average Home Value in this Area
Purchase History
| Date | Buyer | Sale Price | Title Company |
|---|---|---|---|
| Aguilera Joe | -- | None Available | |
| Aguilera Cheryl L | -- | First American Title Company | |
| Aguilera Joe C | $141,500 | Commonwealth Land Title Co |
Source: Public Records
Mortgage History
| Date | Status | Borrower | Loan Amount |
|---|---|---|---|
| Open | Aguilera Cheryl L | $270,000 | |
| Closed | Aguilera Joe C | $127,350 |
Source: Public Records
Tax History
| Year | Tax Paid | Tax Assessment Tax Assessment Total Assessment is a certain percentage of the fair market value that is determined by local assessors to be the total taxable value of land and additions on the property. | Land | Improvement |
|---|---|---|---|---|
| 2025 | $2,823 | $258,772 | $59,461 | $199,311 |
| 2024 | $2,746 | $253,698 | $58,295 | $195,403 |
| 2023 | $2,669 | $248,724 | $57,152 | $191,572 |
| 2022 | $2,652 | $243,847 | $56,031 | $187,816 |
| 2021 | $2,599 | $239,065 | $54,932 | $184,133 |
| 2020 | $2,565 | $236,614 | $54,369 | $182,245 |
| 2019 | $2,519 | $231,975 | $53,303 | $178,672 |
| 2018 | $2,462 | $227,427 | $52,258 | $175,169 |
| 2017 | $2,417 | $222,967 | $51,233 | $171,734 |
| 2016 | $2,258 | $218,595 | $50,228 | $168,367 |
| 2015 | $2,211 | $215,312 | $49,474 | $165,838 |
| 2014 | $2,166 | $211,094 | $48,505 | $162,589 |
Source: Public Records
Map
Nearby Homes
- 12997 Falcon Place
- 13284 Cypress Ave
- 13035 Arlington Ln
- 6756 Summerfield Ct
- 12737 Carob Ct
- 6766 Foxcroft Ct
- 12834 Zinnea Ave
- 12650 Cypress Ave
- 14000 San Antonio Ave
- 6057 Barbara St
- 5963 Rosario St
- 5925 Riverside Dr Unit 12
- 6703 Poinsettia Ct
- 6568 Homan Ct
- 4602 Granville Ct
- 11610 Granville Place
- 6221 Garfield St
- 13462 Mashona Ave
- 12482 Silkleaf Ave
- 2819 S Euclid Ave
- 13058 Cypress Ave
- 13072 Cypress Ave
- 13065 Smoketree Place
- 13046 Cypress Ave
- 13084 Cypress Ave
- 13053 Smoketree Place
- 13077 Smoketree Place
- 13041 Smoketree Place
- 13089 Smoketree Place
- 13034 Cypress Ave
- 13031 Smoketree Place
- 13037 Smoketree Place
- 13056 Falcon Place
- 13046 Falcon Place
- 13066 Falcon Place
- 13036 Falcon Place
- 6489 Elena St
- 6495 Elena St
- 13076 Falcon Place
- 13025 Smoketree Place
Your Personal Tour Guide
Ask me questions while you tour the home.