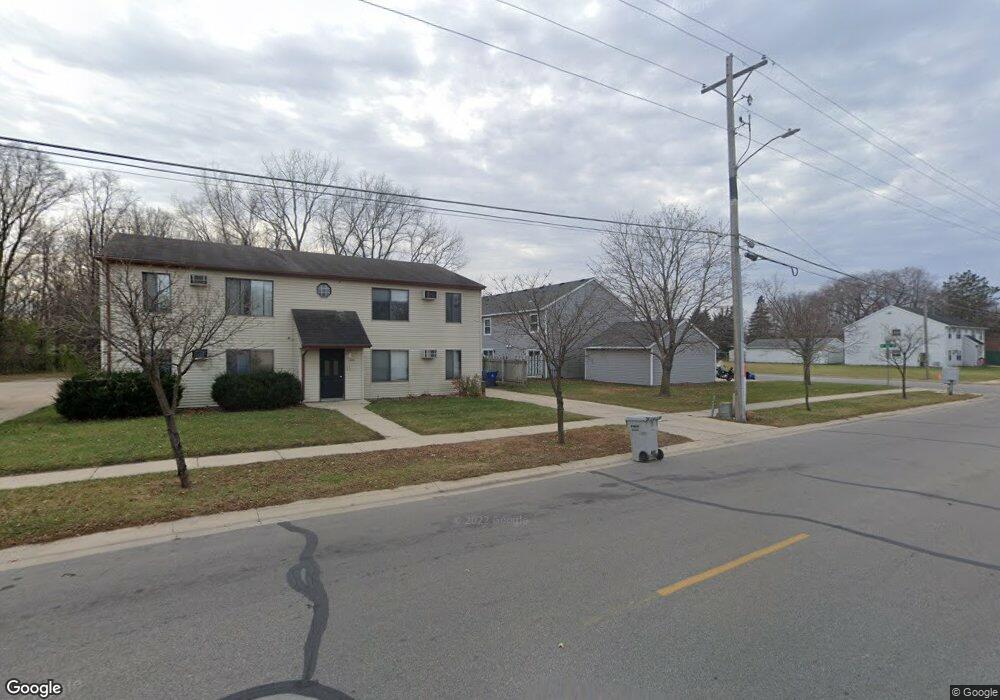
1307 8 1 2 St SE Rochester, MN 55904
Slatterly Park NeighborhoodEstimated Value: $227,528 - $266,000
4
Beds
1
Bath
2,096
Sq Ft
$118/Sq Ft
Est. Value
About This Home
This home is located at 1307 8 1 2 St SE, Rochester, MN 55904 and is currently estimated at $247,632, approximately $118 per square foot. 1307 8 1 2 St SE is a home located in Olmsted County with nearby schools including Riverside Central Elementary School, Willow Creek Middle School, and Mayo Senior High School.
Ownership History
Date
Name
Owned For
Owner Type
Purchase Details
Closed on
Feb 5, 2009
Sold by
Secretary Of Housing & Urban Development
Bought by
Pederson Heidi A
Current Estimated Value
Home Financials for this Owner
Home Financials are based on the most recent Mortgage that was taken out on this home.
Original Mortgage
$77,665
Outstanding Balance
$48,989
Interest Rate
5.06%
Mortgage Type
FHA
Estimated Equity
$198,644
Purchase Details
Closed on
Jan 16, 2008
Sold by
Mortgage Electronic Registration Systems
Bought by
Secretary Of Housing & Urban Development
Purchase Details
Closed on
Jun 28, 2007
Sold by
Beyer Barbara J
Bought by
Mortgage Electronic Registration Systems
Purchase Details
Closed on
Dec 1, 2005
Sold by
Huffman Claire Lucille and Keller Charles
Bought by
Beyer Barbara J
Home Financials for this Owner
Home Financials are based on the most recent Mortgage that was taken out on this home.
Original Mortgage
$105,519
Interest Rate
6.36%
Mortgage Type
FHA
Create a Home Valuation Report for This Property
The Home Valuation Report is an in-depth analysis detailing your home's value as well as a comparison with similar homes in the area
Home Values in the Area
Average Home Value in this Area
Purchase History
| Date | Buyer | Sale Price | Title Company |
|---|---|---|---|
| Pederson Heidi A | -- | None Available | |
| Secretary Of Housing & Urban Development | -- | None Available | |
| Mortgage Electronic Registration Systems | $112,786 | None Available | |
| Beyer Barbara J | $113,000 | None Available |
Source: Public Records
Mortgage History
| Date | Status | Borrower | Loan Amount |
|---|---|---|---|
| Open | Pederson Heidi A | $77,665 | |
| Previous Owner | Beyer Barbara J | $105,519 |
Source: Public Records
Tax History Compared to Growth
Tax History
| Year | Tax Paid | Tax Assessment Tax Assessment Total Assessment is a certain percentage of the fair market value that is determined by local assessors to be the total taxable value of land and additions on the property. | Land | Improvement |
|---|---|---|---|---|
| 2024 | $2,476 | $197,000 | $30,000 | $167,000 |
| 2023 | $2,418 | $204,400 | $30,000 | $174,400 |
| 2022 | $1,982 | $186,000 | $30,000 | $156,000 |
| 2021 | $1,928 | $163,400 | $25,000 | $138,400 |
| 2020 | $1,866 | $159,500 | $25,000 | $134,500 |
| 2019 | $1,530 | $150,200 | $25,000 | $125,200 |
| 2018 | $1,356 | $128,800 | $15,000 | $113,800 |
| 2017 | $1,344 | $117,600 | $15,000 | $102,600 |
| 2016 | $1,372 | $87,700 | $11,500 | $76,200 |
| 2015 | $1,274 | $88,100 | $11,500 | $76,600 |
| 2014 | $1,264 | $88,100 | $11,500 | $76,600 |
| 2012 | -- | $89,300 | $11,537 | $77,763 |
Source: Public Records
Map
Nearby Homes
- 1212 7th St SE
- 725 11th Ave SE
- 1337 6th St SE
- 772 Neville Ct SE
- 770 Neville Ct SE
- 412 12th Ave SE
- 713 8th Ave SE
- 890 W Village Cir SE
- 845 6th Ave SE
- 126 11th Ave SE
- 1646 2nd St SE
- 839 5th Ave SE
- 208 8th Ave SE
- 606 11th St SE
- 1043 6th Ave SE
- 1138 6th Ave SE
- 1211 8th Ave SE
- 915 E Center St
- 909 E Center St
- 815 E Center St
- 1307 8 1/2 St SE
- 1303 8 1 2 St SE
- 1311 8 1/2 St SE
- 1311 8 1 2 St SE
- 1303 8 1/2 St SE
- 806 13th Ave SE
- 1315 8 1/2 St SE
- 1315 8 1 2 St SE
- 801 15th Ave SE
- 1304 8 1/2 St SE
- 802 802 13th-Avenue-se
- 802 13th Ave SE
- 1312 8 1/2 St SE
- 720 13th Ave SE
- 803 13th Ave SE
- 1318 8 1/2 St SE
- 834 13th Ave SE
- 811 811 13th-Avenue-se
- 1318 8 1 2 St SE
- 811 13th Ave SE