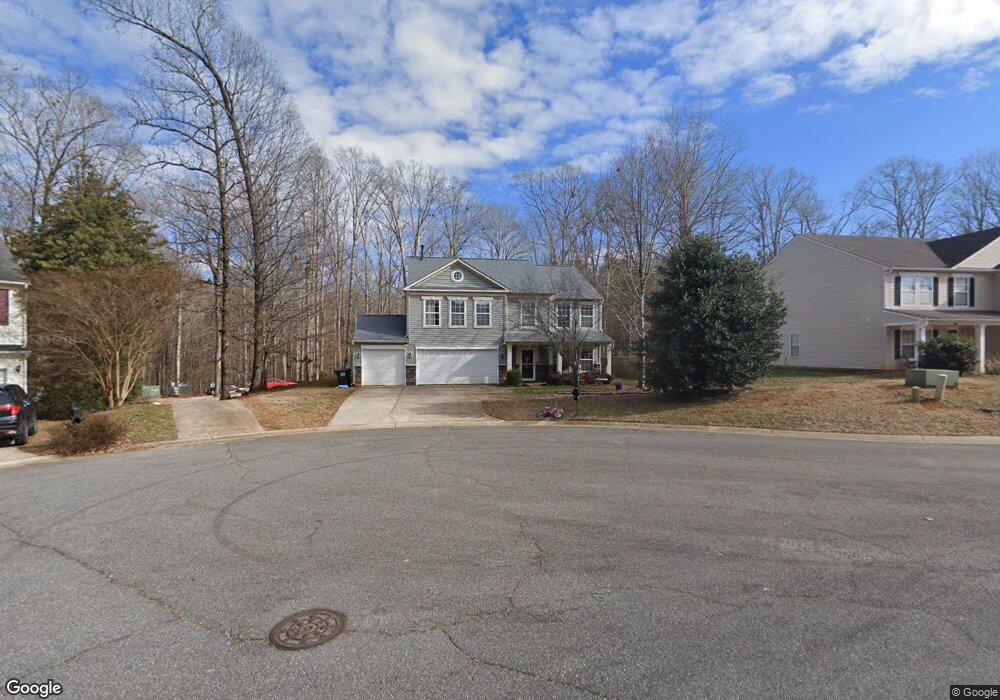
1307 Dunmore Ct Clover, SC 29710
Estimated Value: $399,000 - $433,000
--
Bed
--
Bath
2,974
Sq Ft
$139/Sq Ft
Est. Value
About This Home
This home is located at 1307 Dunmore Ct, Clover, SC 29710 and is currently estimated at $414,463, approximately $139 per square foot. 1307 Dunmore Ct is a home located in York County with nearby schools including Griggs Road Elementary School, Clover Middle School, and Clover High School.
Ownership History
Date
Name
Owned For
Owner Type
Purchase Details
Closed on
Mar 31, 2017
Sold by
Auman Robert A and Auman Wendy L
Bought by
Hawkins Newbern Christopher Nathan and Hawkins Newbern Megan
Current Estimated Value
Home Financials for this Owner
Home Financials are based on the most recent Mortgage that was taken out on this home.
Original Mortgage
$213,560
Outstanding Balance
$176,571
Interest Rate
4.15%
Mortgage Type
FHA
Estimated Equity
$237,892
Purchase Details
Closed on
Mar 10, 2006
Sold by
The Matherson Co Inc
Bought by
C P Morgan Communities Of Charlotte Llc
Purchase Details
Closed on
May 3, 2005
Sold by
C P Morgan Communities Of Charlotte Llc
Bought by
Auman Robert A and Auman Wendy L
Home Financials for this Owner
Home Financials are based on the most recent Mortgage that was taken out on this home.
Original Mortgage
$189,654
Interest Rate
6.39%
Mortgage Type
FHA
Create a Home Valuation Report for This Property
The Home Valuation Report is an in-depth analysis detailing your home's value as well as a comparison with similar homes in the area
Home Values in the Area
Average Home Value in this Area
Purchase History
| Date | Buyer | Sale Price | Title Company |
|---|---|---|---|
| Hawkins Newbern Christopher Nathan | $217,500 | None Available | |
| C P Morgan Communities Of Charlotte Llc | $219,420 | None Available | |
| Auman Robert A | $192,631 | None Available |
Source: Public Records
Mortgage History
| Date | Status | Borrower | Loan Amount |
|---|---|---|---|
| Open | Hawkins Newbern Christopher Nathan | $213,560 | |
| Previous Owner | Auman Robert A | $189,654 |
Source: Public Records
Tax History Compared to Growth
Tax History
| Year | Tax Paid | Tax Assessment Tax Assessment Total Assessment is a certain percentage of the fair market value that is determined by local assessors to be the total taxable value of land and additions on the property. | Land | Improvement |
|---|---|---|---|---|
| 2025 | $1,440 | $10,516 | $1,446 | $9,070 |
| 2024 | $1,292 | $9,145 | $1,600 | $7,545 |
| 2023 | $1,326 | $9,149 | $1,600 | $7,549 |
| 2022 | $1,092 | $9,149 | $1,600 | $7,549 |
| 2021 | -- | $9,149 | $1,600 | $7,549 |
| 2020 | $1,036 | $9,149 | $0 | $0 |
| 2019 | $1,003 | $8,120 | $0 | $0 |
| 2018 | $1,008 | $8,120 | $0 | $0 |
| 2017 | $721 | $8,120 | $0 | $0 |
| 2016 | $680 | $6,240 | $0 | $0 |
| 2014 | $866 | $6,240 | $1,000 | $5,240 |
| 2013 | $866 | $7,600 | $1,200 | $6,400 |
Source: Public Records
Map
Nearby Homes
- 1300 Dunmore Ct
- 961 Poplar Forest Ridge
- 1909 Leesburg Dr
- 1961 Leesburg Dr
- 1965 Leesburg Dr
- 3079 Riker St
- 2599 Highway 557 None
- 2718 Odessa Dr
- 2104 Gillette Dr
- 1876 Tradd Ave
- 1821 Tradd Ave
- 1817 Tradd Ave
- 1288 Century Dr
- 1280 Century Dr
- 1223 Century Dr
- 1219 Century Dr
- 221 Burree Rd
- 633 Cassidy Ct
- 629 Cassidy Ct
- 625 Cassidy Ct
- 1311 Dunmore Ct
- 1303 Dunmore Ct
- 1315 Dunmore Ct
- 1308 Dunmore Ct
- 1304 Dunmore Ct
- 1149 Fenwick Ct
- 1319 Dunmore Ct
- 1145 Fenwick Ct
- 962 Poplar Forest Ridge
- 1323 Dunmore Ct
- 1322 Dunmore Ct
- 961 Poplar Forest Ridge Unit 52
- 958 Poplar Forest Ridge
- 1141 Fenwick Ct
- 1327 Dunmore Ct
- 957 Poplar Forest Ridge
- 957R Poplar Forest Ridge
- 957 Poplar Forest Ridge Unit 51
- 1144 Fenwick Ct
- 954 Poplar Forest Ridge