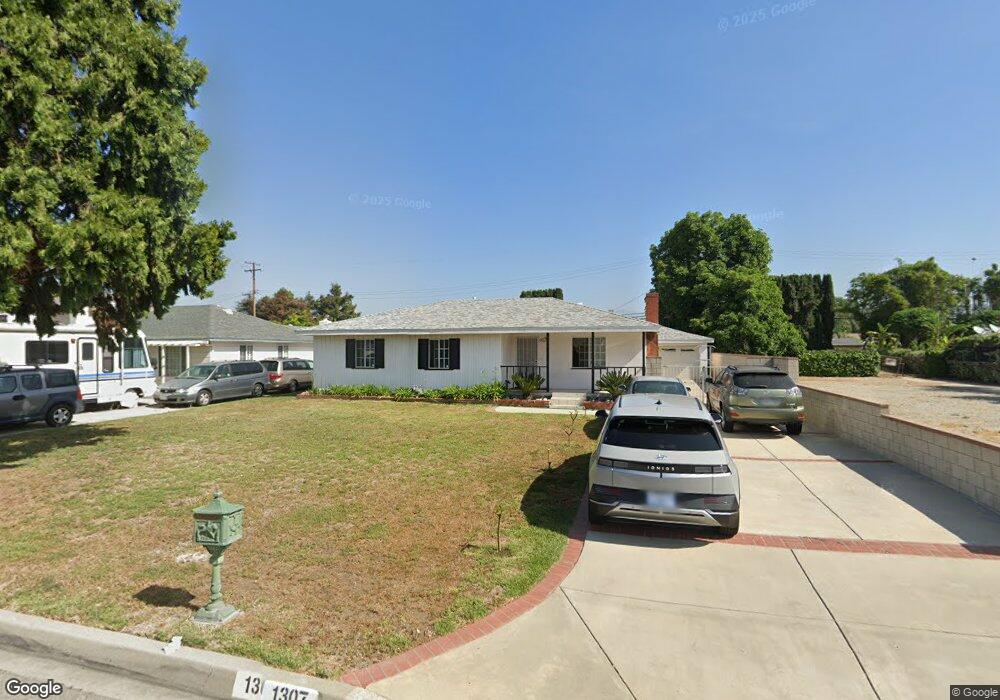
1307 E Herring Ave West Covina, CA 91790
Estimated Value: $775,000 - $873,000
2
Beds
2
Baths
1,530
Sq Ft
$543/Sq Ft
Est. Value
About This Home
This home is located at 1307 E Herring Ave, West Covina, CA 91790 and is currently estimated at $831,283, approximately $543 per square foot. 1307 E Herring Ave is a home located in Los Angeles County with nearby schools including Cameron Elementary School, Hollencrest Middle School, and West Covina High School.
Ownership History
Date
Name
Owned For
Owner Type
Purchase Details
Closed on
Sep 12, 2018
Sold by
Dinh Ly Thi
Bought by
Dinh Ly Thi and Ly Thi Dinh Revocable Living T
Current Estimated Value
Purchase Details
Closed on
Feb 25, 2013
Sold by
Dinh Maj Thi and Dinh Phong John
Bought by
Dinh Ly Thi
Home Financials for this Owner
Home Financials are based on the most recent Mortgage that was taken out on this home.
Original Mortgage
$150,000
Outstanding Balance
$105,177
Interest Rate
3.4%
Mortgage Type
New Conventional
Estimated Equity
$726,106
Purchase Details
Closed on
Jan 11, 2011
Sold by
Dinh Mai T
Bought by
Dinh Mai Thi and Phong John P
Purchase Details
Closed on
Jul 8, 2009
Sold by
Dinh Mai T
Bought by
Dinh Mai T
Home Financials for this Owner
Home Financials are based on the most recent Mortgage that was taken out on this home.
Original Mortgage
$262,500
Interest Rate
5.17%
Mortgage Type
New Conventional
Purchase Details
Closed on
Feb 21, 2006
Sold by
Tran Daniel and Tran Dat Tat
Bought by
Dinh Mai T
Create a Home Valuation Report for This Property
The Home Valuation Report is an in-depth analysis detailing your home's value as well as a comparison with similar homes in the area
Purchase History
| Date | Buyer | Sale Price | Title Company |
|---|---|---|---|
| Dinh Ly Thi | -- | None Available | |
| Dinh Ly Thi | $225,000 | First American Title Company | |
| Dinh Mai Thi | -- | None Available | |
| Dinh Mai T | -- | Chicago Title | |
| Dinh Mai T | -- | None Available |
Source: Public Records
Mortgage History
| Date | Status | Borrower | Loan Amount |
|---|---|---|---|
| Open | Dinh Ly Thi | $150,000 | |
| Previous Owner | Dinh Mai T | $262,500 |
Source: Public Records
Tax History
| Year | Tax Paid | Tax Assessment Tax Assessment Total Assessment is a certain percentage of the fair market value that is determined by local assessors to be the total taxable value of land and additions on the property. | Land | Improvement |
|---|---|---|---|---|
| 2025 | $5,514 | $430,989 | $246,282 | $184,707 |
| 2024 | $5,514 | $422,539 | $241,453 | $181,086 |
| 2023 | $5,245 | $414,255 | $236,719 | $177,536 |
| 2022 | $5,287 | $406,133 | $232,078 | $174,055 |
| 2021 | $5,140 | $398,171 | $227,528 | $170,643 |
| 2019 | $5,005 | $386,363 | $220,780 | $165,583 |
| 2018 | $4,731 | $378,788 | $216,451 | $162,337 |
| 2016 | $4,328 | $364,081 | $208,047 | $156,034 |
| 2015 | $4,242 | $358,613 | $204,922 | $153,691 |
| 2014 | $4,220 | $351,589 | $200,908 | $150,681 |
Source: Public Records
Map
Nearby Homes
- 1414 E Thackery Ave
- 1446 E Herring Ave
- 1141 E Cameron Ave
- 1117 E Thackery St
- 1031 S Pima Ave
- 1655 Aspen Village Way
- 1678 Aspen Village Way
- 1684 Aspen Village Way
- 1682 Aspen Village Way
- 1031 E Larkwood St
- 1799 Aspen Village Way Unit 12
- 1752 Aspen Village Way
- 1767 Aspen Village Way
- 1106 S Serenade Ave
- 309 S Ashdale St
- 962 Waverly Place
- 401 S Cherrywood St
- 16559 Mcwood St
- 639 S Cajon Ave
- 149 S Bandy Ave
- 1301 E Herring Ave
- 1317 E Herring Ave
- 820 S Avington Ave
- 1241 E Herring Ave
- 821 S Avington Ave
- 1321 E Herring Ave
- 1237 E Herring Ave
- 816 S Avington Ave
- 1306 E Herring Ave
- 817 S Avington Ave
- 1310 E Herring Ave
- 1333 E Herring Ave
- 1300 E Herring Ave
- 1231 E Herring Ave
- 1316 E Herring Ave
- 1320 E Herring Ave
- 1242 E Herring Ave
- 808 S Avington Ave
- 809 S Avington Ave
- 1236 E Herring Ave
Your Personal Tour Guide
Ask me questions while you tour the home.