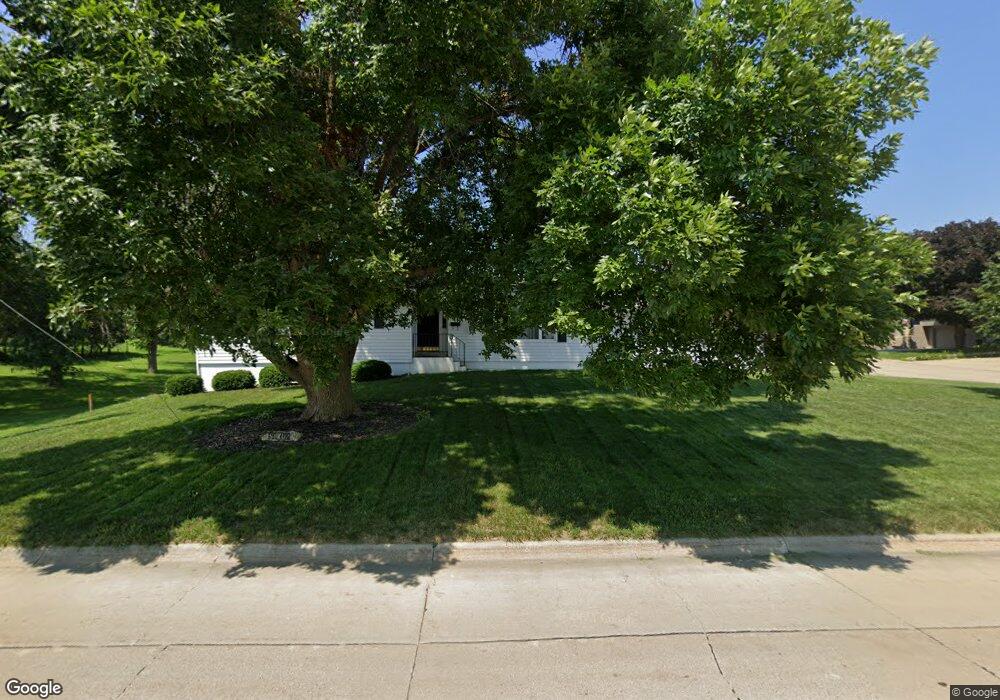
1307 N 14th St Norfolk, NE 68701
Estimated Value: $280,000 - $324,000
3
Beds
3
Baths
1,545
Sq Ft
$194/Sq Ft
Est. Value
About This Home
This home is located at 1307 N 14th St, Norfolk, NE 68701 and is currently estimated at $299,144, approximately $193 per square foot. 1307 N 14th St is a home located in Madison County with nearby schools including Norfolk Senior High School, St. Paul's Lutheran School, and Keystone Christian Academy.
Ownership History
Date
Name
Owned For
Owner Type
Purchase Details
Closed on
Jun 26, 2008
Sold by
Meyer William C and Meyer Joy S
Bought by
Sukup Ryan D
Current Estimated Value
Home Financials for this Owner
Home Financials are based on the most recent Mortgage that was taken out on this home.
Original Mortgage
$140,950
Outstanding Balance
$90,447
Interest Rate
6.05%
Mortgage Type
New Conventional
Estimated Equity
$208,697
Purchase Details
Closed on
Jun 20, 2008
Sold by
Meyer William C and Meyer Koy C
Bought by
Sukup Ryan D and Eggerling Rachel M
Home Financials for this Owner
Home Financials are based on the most recent Mortgage that was taken out on this home.
Original Mortgage
$140,950
Outstanding Balance
$90,447
Interest Rate
6.05%
Mortgage Type
New Conventional
Estimated Equity
$208,697
Purchase Details
Closed on
Jul 30, 2004
Sold by
Lammers Frank J and Lammers Krisa R
Bought by
Meyer William C and Meyer Joy S
Create a Home Valuation Report for This Property
The Home Valuation Report is an in-depth analysis detailing your home's value as well as a comparison with similar homes in the area
Home Values in the Area
Average Home Value in this Area
Purchase History
| Date | Buyer | Sale Price | Title Company |
|---|---|---|---|
| Sukup Ryan D | $138,200 | -- | |
| Sukup Ryan D | $139,000 | None Available | |
| Meyer William C | $134,000 | -- |
Source: Public Records
Mortgage History
| Date | Status | Borrower | Loan Amount |
|---|---|---|---|
| Open | Sukup Ryan D | $140,950 |
Source: Public Records
Tax History Compared to Growth
Tax History
| Year | Tax Paid | Tax Assessment Tax Assessment Total Assessment is a certain percentage of the fair market value that is determined by local assessors to be the total taxable value of land and additions on the property. | Land | Improvement |
|---|---|---|---|---|
| 2024 | $3,272 | $265,074 | $19,980 | $245,094 |
| 2023 | $4,644 | $251,201 | $19,980 | $231,221 |
| 2022 | $4,197 | $226,427 | $19,980 | $206,447 |
| 2021 | $3,874 | $209,381 | $19,980 | $189,401 |
| 2020 | $3,862 | $209,381 | $19,980 | $189,401 |
| 2019 | $3,731 | $195,351 | $19,980 | $175,371 |
| 2018 | $3,544 | $188,671 | $19,980 | $168,691 |
| 2017 | $3,297 | $175,306 | $19,980 | $155,326 |
| 2016 | $3,304 | $175,306 | $19,980 | $155,326 |
| 2015 | $3,304 | $175,306 | $19,980 | $155,326 |
| 2014 | $2,828 | $145,689 | $12,009 | $133,680 |
| 2013 | $2,744 | $136,944 | $12,009 | $124,935 |
Source: Public Records
Map
Nearby Homes
- 1704 Laurel Ln
- 1208 Grant Ave
- 1203 Greenlawn Dr
- 1705 Syracuse Ave
- 1403 Bel Air Rd
- 1604 Bel Air Rd
- 1309 Galeta Ave
- 1306 Hillview Dr
- 1504 Glenmore Dr
- 1709 Skyline Dr
- 1400 Charolais Dr
- 1601 Sheridan Dr
- 1415 Charolais Dr
- 1506 Charolais Dr
- 906 Harrison Ave
- 1116 Longhorn Dr
- 1603 Charolais Dr
- 1104 Angus Dr
- 709 Northdale Dr
- 1108 Longhorn Dr
- 1403 Clark St
- 1400 W Benjamin Ave
- 1401 N 14th St
- 1405 Clark St
- 1402 Clark St
- 1410 W Benjamin Ave
- 1404 Clark St
- 1501 Clark St
- 1403 N 14th St
- 1500 Clark St
- 1403 Syracuse Ave
- 1405 Syracuse Ave
- 1214 Meadow Dr
- 1501 Syracuse Ave
- 1502 Clark St
- 1215 Meadow Dr
- 1504 W Benjamin Ave
- 1505 Clark St
- 1503 Syracuse Ave
- 1504 Clark St