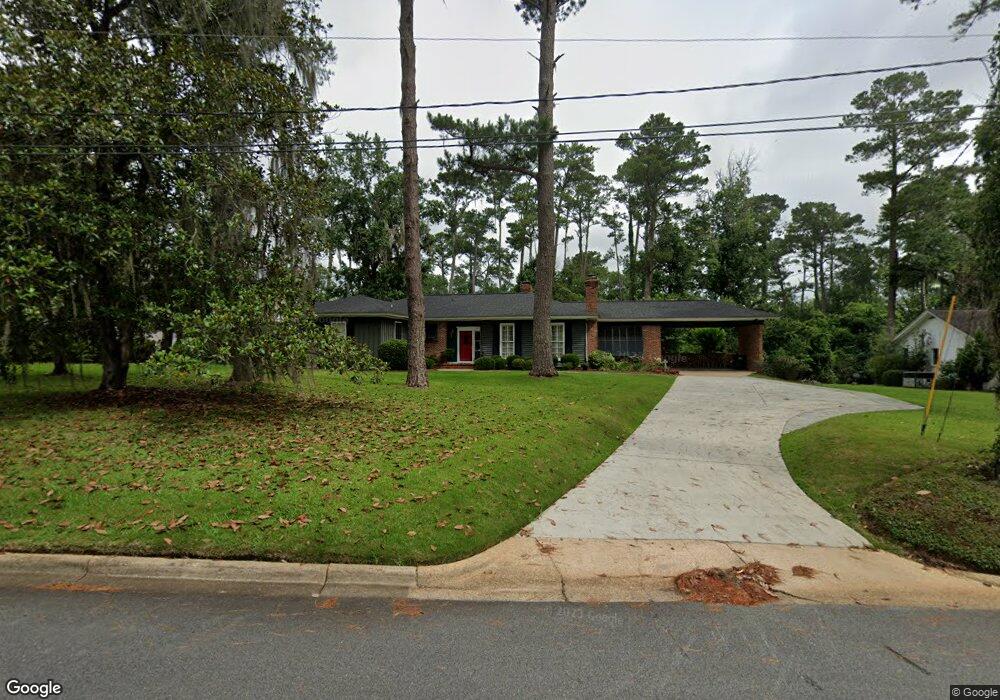
1307 Pinecrest Dr Albany, GA 31707
Palmyra Heights NeighborhoodEstimated Value: $174,000 - $203,000
3
Beds
2
Baths
2,055
Sq Ft
$92/Sq Ft
Est. Value
About This Home
This home is located at 1307 Pinecrest Dr, Albany, GA 31707 and is currently estimated at $189,371, approximately $92 per square foot. 1307 Pinecrest Dr is a home located in Dougherty County with nearby schools including Sherwood Acres Elementary School, Merry Acres Middle School, and Albany High School.
Ownership History
Date
Name
Owned For
Owner Type
Purchase Details
Closed on
Sep 2, 2014
Sold by
Watson Larry Woodrow
Bought by
Beaver Amy R
Current Estimated Value
Purchase Details
Closed on
Jul 20, 2005
Sold by
Lee James C
Bought by
Watson Larry W and Watson Lauren W
Home Financials for this Owner
Home Financials are based on the most recent Mortgage that was taken out on this home.
Original Mortgage
$70,000
Interest Rate
5.14%
Mortgage Type
New Conventional
Purchase Details
Closed on
Sep 28, 2001
Sold by
Jackson M Harby Family Trust
Bought by
Lee James C and Lee Dorothy R
Purchase Details
Closed on
Jan 18, 2001
Sold by
Harby Jackson M
Bought by
Jackson M Harby Family Trust
Purchase Details
Closed on
Jan 18, 2000
Sold by
Harby Winifred C
Bought by
Harby Jackson M
Purchase Details
Closed on
Apr 1, 1987
Sold by
Harby Jackson and Harby Tal
Bought by
Harby Winifred Etal
Create a Home Valuation Report for This Property
The Home Valuation Report is an in-depth analysis detailing your home's value as well as a comparison with similar homes in the area
Home Values in the Area
Average Home Value in this Area
Purchase History
| Date | Buyer | Sale Price | Title Company |
|---|---|---|---|
| Beaver Amy R | $160,000 | -- | |
| Watson Larry W | $164,000 | -- | |
| Lee James C | $115,000 | -- | |
| Jackson M Harby Family Trust | -- | -- | |
| Harby Jackson M | -- | -- | |
| Harby Winifred Etal | -- | -- |
Source: Public Records
Mortgage History
| Date | Status | Borrower | Loan Amount |
|---|---|---|---|
| Previous Owner | Watson Larry W | $70,000 |
Source: Public Records
Tax History Compared to Growth
Tax History
| Year | Tax Paid | Tax Assessment Tax Assessment Total Assessment is a certain percentage of the fair market value that is determined by local assessors to be the total taxable value of land and additions on the property. | Land | Improvement |
|---|---|---|---|---|
| 2024 | $2,000 | $48,176 | $8,760 | $39,416 |
| 2023 | $1,112 | $48,176 | $8,760 | $39,416 |
| 2022 | $1,957 | $48,176 | $8,760 | $39,416 |
| 2021 | $1,806 | $48,176 | $8,760 | $39,416 |
| 2020 | $1,810 | $48,176 | $8,760 | $39,416 |
| 2019 | $1,817 | $48,176 | $8,760 | $39,416 |
| 2018 | $1,825 | $48,176 | $8,760 | $39,416 |
| 2017 | $1,692 | $48,176 | $8,760 | $39,416 |
| 2016 | $1,693 | $48,176 | $8,760 | $39,416 |
| 2015 | $1,743 | $48,176 | $8,760 | $39,416 |
| 2014 | $2,203 | $56,496 | $17,080 | $39,416 |
Source: Public Records
Map
Nearby Homes
- 1403 Edgewood Ln
- 1207 Pinecrest Dr
- 1506 7th Ave
- 1502 Argonne Dr
- 1505 5th Ave
- 1314 9th Ave
- 1307 8th Ave
- 1607 11th Ave
- 1316 11th Ave
- 1307 5th Ave
- 1201 Hilltop Dr
- 1101 Valley Rd
- 1234 Hilltop Dr
- 1307 W 4th Ave
- 1907 Homewood Dr
- 1907 Edgewood Ln
- 1801 Oak Glen Ln
- 1512 W 2nd Ave
- 1805 Pineknoll Ln
- 1807 Pineknoll Ln
- 1305 Pinecrest Dr
- 1309 Pinecrest Dr
- 1411 Pinecrest Dr
- 1303 Pinecrest Dr
- 1310 Pinecrest Dr
- 1301 Pinecrest Dr
- 1410 Pinecrest Dr
- 1415 Pinecrest Dr
- 1210 Pinecrest Dr
- 1414 Pinecrest Dr
- 1402 Edgewood Ln
- 1417 Pinecrest Dr
- 1400 Edgewood Ln
- 1512 Argonne Dr
- 1510 Argonne Dr
- 1418 Pinecrest Dr
- 1514 Argonne Dr
- 1516 Argonne Dr
- 1305 Edgewood Ln
- 1509 7th Ave