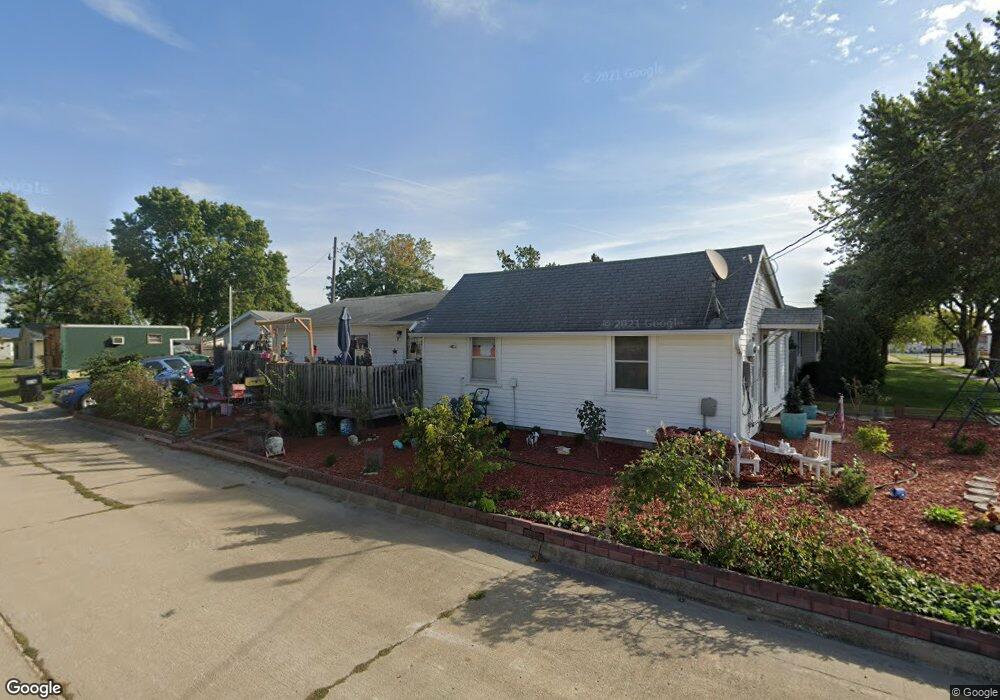
1307 W 4th St Vinton, IA 52349
Estimated Value: $125,000 - $130,000
3
Beds
1
Bath
1,148
Sq Ft
$111/Sq Ft
Est. Value
About This Home
This home is located at 1307 W 4th St, Vinton, IA 52349 and is currently estimated at $127,500, approximately $111 per square foot. 1307 W 4th St is a home located in Benton County with nearby schools including Tilford Elementary School, Shellsburg Elementary School, and Vinton-Shellsburg Middle School.
Ownership History
Date
Name
Owned For
Owner Type
Purchase Details
Closed on
Nov 13, 2023
Sold by
Butterfield Cortland
Bought by
Lovell Patrick L and Lovell Libby A
Current Estimated Value
Purchase Details
Closed on
Nov 1, 2023
Sold by
Wade John Wesley and Wade Yvonne Kathleen
Bought by
Butterfield Cortland W
Purchase Details
Closed on
Jul 3, 2015
Sold by
Butterfield Cortland W
Bought by
Wade John Wesley and Wade Yvonne Kathleen
Purchase Details
Closed on
Jun 2, 2014
Sold by
Murphy Candice
Bought by
Butterfield Corton
Create a Home Valuation Report for This Property
The Home Valuation Report is an in-depth analysis detailing your home's value as well as a comparison with similar homes in the area
Home Values in the Area
Average Home Value in this Area
Purchase History
| Date | Buyer | Sale Price | Title Company |
|---|---|---|---|
| Lovell Patrick L | $40,000 | None Listed On Document | |
| Butterfield Cortland W | $20,000 | None Listed On Document | |
| Wade John Wesley | -- | None Available | |
| Butterfield Corton | $20,000 | None Available |
Source: Public Records
Tax History Compared to Growth
Tax History
| Year | Tax Paid | Tax Assessment Tax Assessment Total Assessment is a certain percentage of the fair market value that is determined by local assessors to be the total taxable value of land and additions on the property. | Land | Improvement |
|---|---|---|---|---|
| 2025 | $1,746 | $101,200 | $10,600 | $90,600 |
| 2024 | $1,746 | $93,200 | $10,100 | $83,100 |
| 2023 | $1,522 | $93,200 | $10,100 | $83,100 |
| 2022 | $1,560 | $79,600 | $8,100 | $71,500 |
| 2021 | $1,560 | $79,600 | $8,100 | $71,500 |
| 2020 | $1,010 | $55,500 | $8,600 | $46,900 |
| 2019 | $1,064 | $55,500 | $8,600 | $46,900 |
| 2018 | $1,030 | $57,100 | $8,200 | $48,900 |
| 2017 | $984 | $57,100 | $8,200 | $48,900 |
| 2016 | $1,152 | $53,400 | $7,700 | $45,700 |
| 2015 | $1,152 | $53,400 | $7,700 | $45,700 |
| 2014 | $1,208 | $55,900 | $0 | $0 |
Source: Public Records
Map
Nearby Homes