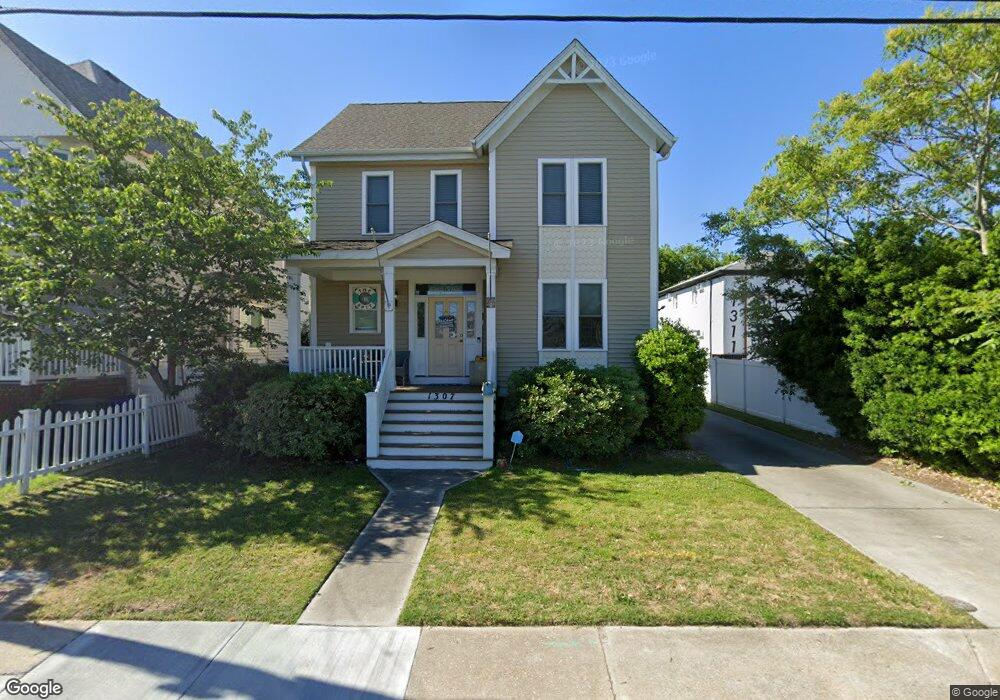
1307 W Ocean View Ave Norfolk, VA 23503
Willoughby NeighborhoodEstimated Value: $477,686 - $514,000
3
Beds
3
Baths
1,908
Sq Ft
$261/Sq Ft
Est. Value
About This Home
This home is located at 1307 W Ocean View Ave, Norfolk, VA 23503 and is currently estimated at $498,422, approximately $261 per square foot. 1307 W Ocean View Ave is a home located in Norfolk City with nearby schools including Ocean View Elementary School, Northside Middle School, and Granby High School.
Ownership History
Date
Name
Owned For
Owner Type
Purchase Details
Closed on
May 30, 2013
Sold by
Richardson Homes Inc
Bought by
Duff Johnnye B
Current Estimated Value
Home Financials for this Owner
Home Financials are based on the most recent Mortgage that was taken out on this home.
Original Mortgage
$270,019
Outstanding Balance
$191,733
Interest Rate
3.45%
Mortgage Type
FHA
Estimated Equity
$306,689
Purchase Details
Closed on
Jan 16, 2013
Sold by
Norfolk Redevelopmnet And Housing Author
Bought by
Richardson Homes Inc and Viridian Homes Llc
Purchase Details
Closed on
Feb 2, 2009
Sold by
Waterfall Victoria Reo Llc
Bought by
Norfolk Redevelopment & Housing Authorit
Purchase Details
Closed on
Mar 25, 2008
Sold by
Meade Harry E
Bought by
Waterfall Victoria Master Fund Ltd
Purchase Details
Closed on
Dec 10, 2004
Sold by
Meade Harry E and Meade Patricia Ellen
Bought by
Meade Harry E
Create a Home Valuation Report for This Property
The Home Valuation Report is an in-depth analysis detailing your home's value as well as a comparison with similar homes in the area
Home Values in the Area
Average Home Value in this Area
Purchase History
| Date | Buyer | Sale Price | Title Company |
|---|---|---|---|
| Duff Johnnye B | $275,000 | Multiple | |
| Richardson Homes Inc | -- | None Available | |
| Norfolk Redevelopment & Housing Authorit | $145,000 | Pioneer Title | |
| Waterfall Victoria Reo Llc | $239,800 | Pioneer Title | |
| Waterfall Victoria Master Fund Ltd | $173,000 | None Available | |
| Meade Harry E | -- | -- |
Source: Public Records
Mortgage History
| Date | Status | Borrower | Loan Amount |
|---|---|---|---|
| Open | Duff Johnnye B | $270,019 |
Source: Public Records
Tax History Compared to Growth
Tax History
| Year | Tax Paid | Tax Assessment Tax Assessment Total Assessment is a certain percentage of the fair market value that is determined by local assessors to be the total taxable value of land and additions on the property. | Land | Improvement |
|---|---|---|---|---|
| 2025 | $5,691 | $455,300 | $125,400 | $329,900 |
| 2024 | $5,526 | $449,300 | $125,400 | $323,900 |
| 2023 | $4,883 | $390,600 | $125,400 | $265,200 |
| 2022 | $4,361 | $348,900 | $109,000 | $239,900 |
| 2021 | $3,991 | $319,300 | $109,000 | $210,300 |
| 2020 | $3,884 | $310,700 | $109,000 | $201,700 |
| 2019 | $3,719 | $297,500 | $109,000 | $188,500 |
| 2018 | $3,539 | $283,100 | $109,000 | $174,100 |
| 2017 | $3,104 | $269,900 | $104,000 | $165,900 |
| 2016 | $3,104 | $104,000 | $104,000 | $0 |
| 2015 | $2,638 | $104,000 | $104,000 | $0 |
| 2014 | $2,638 | $104,000 | $104,000 | $0 |
Source: Public Records
Map
Nearby Homes
- 1318 Little Bay Ave
- 1106 Toler Place
- 9654 14th View St
- 1400 W Ocean View Ave Unit A
- 1233 Little Bay Ave
- 1442 W Ocean View Ave
- 1135 Little Bay Ave
- 1459 Bayville St
- 1080 W Ocean View Ave Unit D
- 1547 Chela Ave
- 1039 Little Bay Ave
- 1566 Lea View Ave Unit 8
- 947 Little Bay Ave
- 865 Little Bay Ave Unit 5
- 835 Little Bay Ave Unit 32
- 831 W Ocean View Ave
- 746 W Ocean View Ave
- 737 W Ocean View Ave Unit A
- 600 W Ocean View Ave Unit C
- 504 W Ocean View Ave
- 1303 W Ocean View Ave
- 1301 W Ocean View Ave
- 1311 W Ocean View Ave
- 9659 13th View St
- 1315 W Ocean View Ave
- 9655 13th View St
- 1319 W Ocean View Ave Unit 2
- 1319 W Ocean View Ave Unit 2
- 1319 W Ocean View Ave
- 1293 W Ocean View Ave Unit 2
- 1293 W Ocean View Ave Unit 1
- 1293 W Ocean View Ave
- 1293 W Ocean View Ave Unit 3
- 1293 W Ocean View Ave Unit 4
- 1310 Little Bay Ave
- 1314 Little Bay Ave Unit 3
- 1314 Little Bay Ave Unit 2
- 1314 Little Bay Ave Unit 7
- 1314 Little Bay Ave Unit 8
- 1314 Little Bay Ave Unit 12