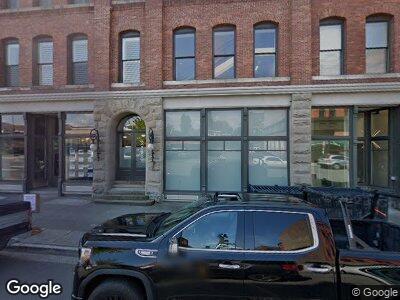
1308 12th St Bellingham, WA 98225
Fairhaven NeighborhoodEstimated Value: $705,000 - $1,948,000
2
Beds
2
Baths
2,048
Sq Ft
$726/Sq Ft
Est. Value
About This Home
This home is located at 1308 12th St, Bellingham, WA 98225 and is currently estimated at $1,486,400, approximately $725 per square foot. 1308 12th St is a home located in Whatcom County with nearby schools including Lowell Elementary School, Fairhaven Middle School, and Sehome High School.
Ownership History
Date
Name
Owned For
Owner Type
Purchase Details
Closed on
Feb 14, 2017
Sold by
Hidden Cove Property Llc
Bought by
Jmh Pnw Llc
Current Estimated Value
Purchase Details
Closed on
Apr 24, 2012
Sold by
Orchard Street Development Llc
Bought by
Hidden Cove Property Llc
Home Financials for this Owner
Home Financials are based on the most recent Mortgage that was taken out on this home.
Original Mortgage
$0
Interest Rate
3.83%
Mortgage Type
Unknown
Purchase Details
Closed on
Sep 27, 2011
Sold by
Ebenal David C and Ebenal Bonita L
Bought by
Orchard Street Development Llc
Purchase Details
Closed on
Aug 30, 2010
Sold by
Fairhaven Investments Llc
Bought by
Ebenal David C and Ebenal Bonita L
Purchase Details
Closed on
Mar 4, 2009
Sold by
Waldron Development Llc
Bought by
Fairhaven Investments Llc
Create a Home Valuation Report for This Property
The Home Valuation Report is an in-depth analysis detailing your home's value as well as a comparison with similar homes in the area
Home Values in the Area
Average Home Value in this Area
Purchase History
| Date | Buyer | Sale Price | Title Company |
|---|---|---|---|
| Jmh Pnw Llc | -- | None Available | |
| Hidden Cove Property Llc | $894,930 | Chicago Title Insurance | |
| Orchard Street Development Llc | -- | None Available | |
| Ebenal David C | -- | None Available | |
| Fairhaven Investments Llc | -- | None Available |
Source: Public Records
Mortgage History
| Date | Status | Borrower | Loan Amount |
|---|---|---|---|
| Previous Owner | Orchard Street Development Llc | $770,000 | |
| Previous Owner | Orchard Street Development Llc | $0 |
Source: Public Records
Tax History Compared to Growth
Tax History
| Year | Tax Paid | Tax Assessment Tax Assessment Total Assessment is a certain percentage of the fair market value that is determined by local assessors to be the total taxable value of land and additions on the property. | Land | Improvement |
|---|---|---|---|---|
| 2024 | $13,927 | $1,790,665 | $93,132 | $1,697,533 |
| 2023 | $13,927 | $1,790,665 | $93,132 | $1,697,533 |
| 2022 | $12,317 | $1,557,063 | $80,982 | $1,476,081 |
| 2021 | $11,600 | $1,319,549 | $68,629 | $1,250,920 |
| 2020 | $11,067 | $1,147,388 | $59,675 | $1,087,713 |
| 2019 | $10,576 | $1,057,500 | $55,000 | $1,002,500 |
| 2018 | $426 | $1,013,373 | $45,507 | $967,866 |
| 2017 | $408 | $35,000 | $35,000 | $0 |
| 2016 | $391 | $35,000 | $35,000 | $0 |
| 2015 | $404 | $35,000 | $35,000 | $0 |
| 2014 | -- | $35,000 | $35,000 | $0 |
| 2013 | -- | $35,000 | $35,000 | $0 |
Source: Public Records
Map
Nearby Homes
- 1101 Mckenzie Ave Unit 203
- 1101 Mckenzie Ave Unit 206
- 1201 11th St Unit 308
- 1101 Harris Ave
- 1309 Larrabee Ave
- 1216 Old Fairhaven Pkwy Unit C203
- 1305 8th St Unit 102
- 1014 11th St Unit 302
- 1005 15th St
- 917 13th St
- 912 11th St Unit 204
- 1100 Taylor Ave
- 1517 4th St Unit 2A
- 121 Underhill Rd
- 700 11th St Unit C4
- 331 Chuckanut Dr N
- 600 S State St Unit 101
- 601 11th St
- 522 12th St
- 425 Chuckanut Dr N Unit 42