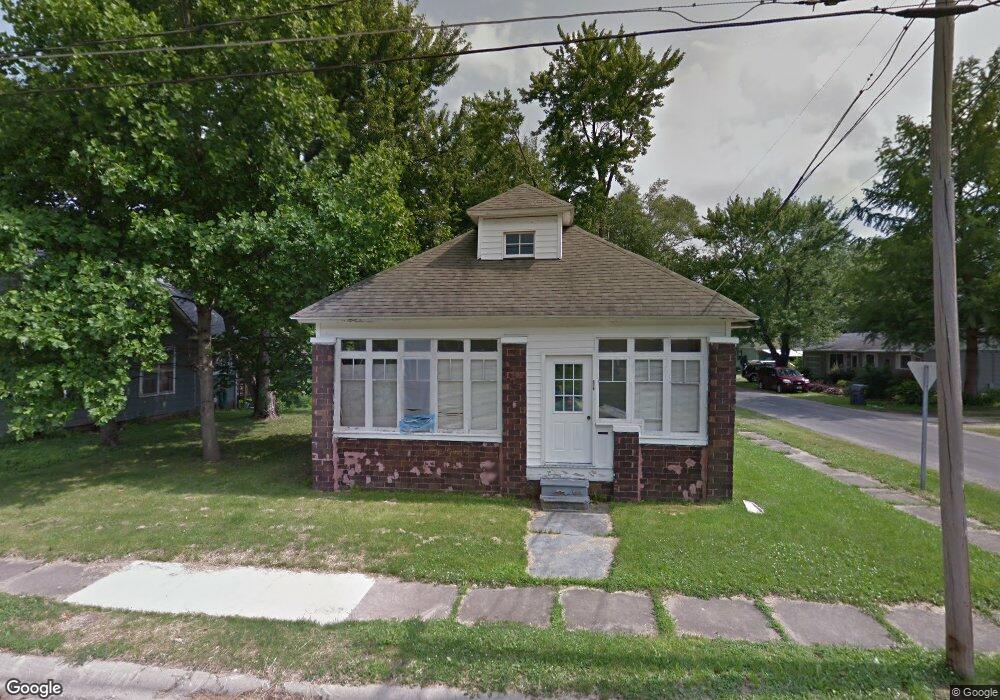
1308 Adams Ave Charleston, IL 61920
Estimated Value: $49,000 - $62,000
3
Beds
1
Bath
2,470
Sq Ft
$22/Sq Ft
Est. Value
About This Home
This home is located at 1308 Adams Ave, Charleston, IL 61920 and is currently estimated at $54,303, approximately $21 per square foot. 1308 Adams Ave is a home located in Coles County with nearby schools including Charleston High School and Charleston Christian Academy.
Ownership History
Date
Name
Owned For
Owner Type
Purchase Details
Closed on
Aug 19, 2022
Sold by
Philip Redmond
Bought by
Kemplen Donald T
Current Estimated Value
Home Financials for this Owner
Home Financials are based on the most recent Mortgage that was taken out on this home.
Original Mortgage
$25,200
Outstanding Balance
$21,700
Interest Rate
6.05%
Mortgage Type
New Conventional
Estimated Equity
$32,603
Purchase Details
Closed on
Oct 31, 2013
Sold by
Parsley Steven
Bought by
Redmond Philip
Purchase Details
Closed on
Sep 25, 2008
Sold by
Dennis Harold C and Dennis Stephen A
Bought by
Parsley Steven and Redmond Philip
Home Financials for this Owner
Home Financials are based on the most recent Mortgage that was taken out on this home.
Original Mortgage
$22,050
Interest Rate
6.43%
Mortgage Type
New Conventional
Purchase Details
Closed on
Mar 14, 2005
Sold by
Dennis Harold C
Bought by
Dennis Stephen A and Dennis Raymond E
Create a Home Valuation Report for This Property
The Home Valuation Report is an in-depth analysis detailing your home's value as well as a comparison with similar homes in the area
Home Values in the Area
Average Home Value in this Area
Purchase History
| Date | Buyer | Sale Price | Title Company |
|---|---|---|---|
| Kemplen Donald T | $31,500 | None Listed On Document | |
| Redmond Philip | -- | -- | |
| Parsley Steven | $24,500 | None Available | |
| Dennis Stephen A | -- | None Available |
Source: Public Records
Mortgage History
| Date | Status | Borrower | Loan Amount |
|---|---|---|---|
| Open | Kemplen Donald T | $25,200 | |
| Previous Owner | Parsley Steven | $22,050 |
Source: Public Records
Tax History Compared to Growth
Tax History
| Year | Tax Paid | Tax Assessment Tax Assessment Total Assessment is a certain percentage of the fair market value that is determined by local assessors to be the total taxable value of land and additions on the property. | Land | Improvement |
|---|---|---|---|---|
| 2024 | $1,109 | $14,287 | $2,205 | $12,082 |
| 2023 | $1,092 | $13,048 | $2,014 | $11,034 |
| 2022 | $583 | $12,833 | $1,981 | $10,852 |
| 2021 | $602 | $12,316 | $1,901 | $10,415 |
| 2020 | $608 | $12,760 | $3,106 | $9,654 |
| 2019 | $579 | $12,316 | $2,998 | $9,318 |
| 2018 | $572 | $12,316 | $2,998 | $9,318 |
| 2017 | $565 | $12,316 | $2,998 | $9,318 |
| 2016 | $560 | $12,316 | $2,998 | $9,318 |
| 2015 | $578 | $12,316 | $2,998 | $9,318 |
| 2014 | $578 | $12,316 | $2,998 | $9,318 |
| 2013 | $578 | $12,316 | $2,998 | $9,318 |
Source: Public Records
Map
Nearby Homes
- 1302 Adams Ave
- 1314 Adams Ave
- 1309 Adams Ave
- 1303 Adams Ave
- 204 13th St
- 1316 Adams Ave
- 1303 Jefferson Ave
- 1315 Jefferson Ave
- 1219 Adams Ave
- 210 13th St
- 1315 Adams Ave
- 1323 Adams Ave
- 1321 Jefferson Ave
- 1326 Adams Ave
- 1217 Jefferson Ave
- 1215 Adams Ave
- 105 13th St
- 1325 Adams Ave
- 1208 Adams Ave
- 1327 Jefferson Ave