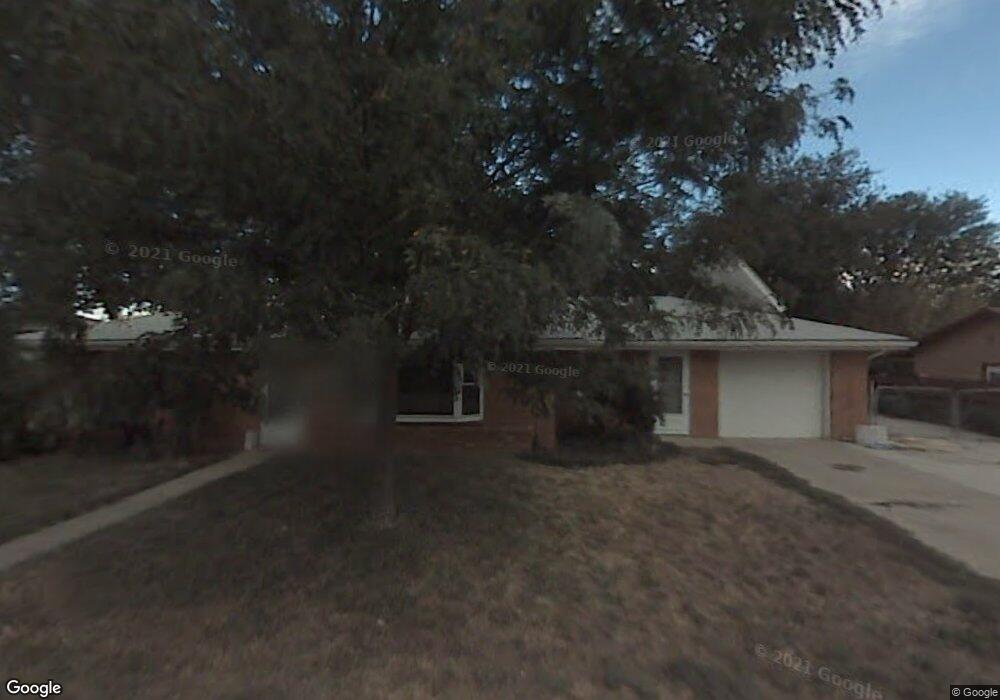
1308 Cherry Ave Loveland, CO 80537
Estimated Value: $430,000 - $504,000
3
Beds
2
Baths
1,620
Sq Ft
$288/Sq Ft
Est. Value
About This Home
This home is located at 1308 Cherry Ave, Loveland, CO 80537 and is currently estimated at $467,012, approximately $288 per square foot. 1308 Cherry Ave is a home located in Larimer County with nearby schools including Namaqua Elementary School, Walt Clark Middle School, and Thompson Valley High School.
Ownership History
Date
Name
Owned For
Owner Type
Purchase Details
Closed on
Jul 29, 2008
Sold by
U S Bank Na
Bought by
Resler Troy L and Musall Camellia J
Current Estimated Value
Home Financials for this Owner
Home Financials are based on the most recent Mortgage that was taken out on this home.
Original Mortgage
$137,837
Outstanding Balance
$90,777
Interest Rate
6.4%
Mortgage Type
FHA
Estimated Equity
$376,235
Purchase Details
Closed on
Apr 2, 2008
Sold by
Carr Daniel A and Carr Cristi
Bought by
U S Bank Na and Structured Asset Securities Corp Series
Purchase Details
Closed on
Apr 27, 2001
Sold by
Hoel Mary L and Hoel Leif O
Bought by
Carr Daniel A and Carr Christi
Home Financials for this Owner
Home Financials are based on the most recent Mortgage that was taken out on this home.
Original Mortgage
$120,000
Interest Rate
9.5%
Purchase Details
Closed on
Oct 1, 1994
Sold by
Willits Marie B
Bought by
Hoel Leif O
Create a Home Valuation Report for This Property
The Home Valuation Report is an in-depth analysis detailing your home's value as well as a comparison with similar homes in the area
Home Values in the Area
Average Home Value in this Area
Purchase History
| Date | Buyer | Sale Price | Title Company |
|---|---|---|---|
| Resler Troy L | $140,000 | None Available | |
| U S Bank Na | -- | None Available | |
| Carr Daniel A | $160,000 | Chicago Title Co | |
| Hoel Leif O | $114,000 | -- |
Source: Public Records
Mortgage History
| Date | Status | Borrower | Loan Amount |
|---|---|---|---|
| Open | Resler Troy L | $137,837 | |
| Previous Owner | Carr Daniel A | $120,000 | |
| Closed | Carr Daniel A | $23,400 |
Source: Public Records
Tax History Compared to Growth
Tax History
| Year | Tax Paid | Tax Assessment Tax Assessment Total Assessment is a certain percentage of the fair market value that is determined by local assessors to be the total taxable value of land and additions on the property. | Land | Improvement |
|---|---|---|---|---|
| 2025 | $2,245 | $31,255 | $1,715 | $29,540 |
| 2024 | $2,167 | $31,255 | $1,715 | $29,540 |
| 2022 | $1,866 | $23,665 | $1,779 | $21,886 |
| 2021 | $1,915 | $24,345 | $1,830 | $22,515 |
| 2020 | $1,985 | $25,239 | $1,830 | $23,409 |
| 2019 | $1,951 | $25,239 | $1,830 | $23,409 |
| 2018 | $1,423 | $17,460 | $1,843 | $15,617 |
| 2017 | $1,224 | $17,460 | $1,843 | $15,617 |
| 2016 | $1,115 | $15,379 | $2,038 | $13,341 |
| 2015 | $1,106 | $15,380 | $2,040 | $13,340 |
| 2014 | $892 | $12,000 | $2,040 | $9,960 |
Source: Public Records
Map
Nearby Homes
- 1304 Pine St
- 1726 Kennedy Ave
- 1682 Stove Prairie Cir
- 1670 Stove Prairie Cir
- 1942 Lakewood Dr
- 2002 Falls Ct
- 2387 W U S 34
- 2217 Durango Dr
- 2467 Farisita Dr
- 2216 Durango Dr
- 3625 Como Ct
- 2264 Durango Dr
- 3363 Cuchara Ct
- 1131 W Broadmoor Dr
- 1506 N Empire Ave
- 1125 W Broadmoor Dr
- 1209 E Broadmoor Dr
- 2370 Fleming Dr
- 2030 W 17th St Unit A8
- 1633 Van Buren Ave Unit 1