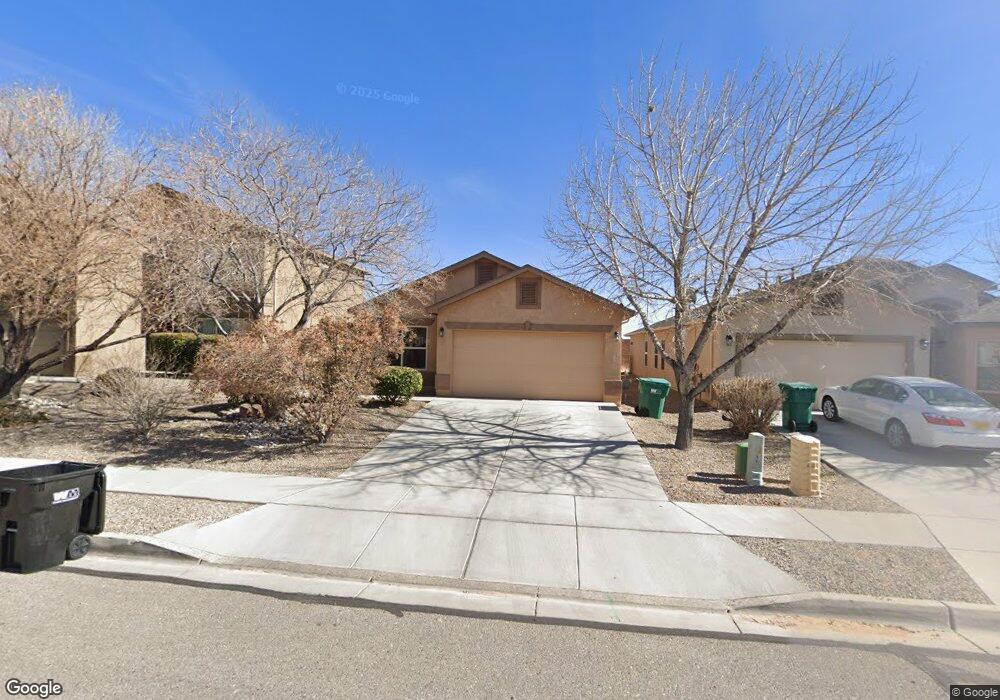
1308 Desert Paintbrush Loop NE Rio Rancho, NM 87144
Northern Meadows NeighborhoodEstimated Value: $300,000 - $327,000
3
Beds
2
Baths
1,564
Sq Ft
$199/Sq Ft
Est. Value
About This Home
This home is located at 1308 Desert Paintbrush Loop NE, Rio Rancho, NM 87144 and is currently estimated at $311,534, approximately $199 per square foot. 1308 Desert Paintbrush Loop NE is a home with nearby schools including Cielo Azul Elementary School, Rio Rancho Middle School, and Cleveland High School.
Ownership History
Date
Name
Owned For
Owner Type
Purchase Details
Closed on
Aug 25, 2021
Sold by
Lage Nataliya
Bought by
Lage Nataliya and Nataliya Lage Revocable Trust
Current Estimated Value
Home Financials for this Owner
Home Financials are based on the most recent Mortgage that was taken out on this home.
Original Mortgage
$125,000
Outstanding Balance
$113,741
Interest Rate
2.8%
Mortgage Type
New Conventional
Estimated Equity
$197,793
Purchase Details
Closed on
Jul 20, 2018
Sold by
Kidder Jacob A
Bought by
Kidder Jacob A and Kidder Ladawn K
Home Financials for this Owner
Home Financials are based on the most recent Mortgage that was taken out on this home.
Original Mortgage
$127,500
Interest Rate
4.5%
Mortgage Type
New Conventional
Purchase Details
Closed on
Sep 30, 2011
Sold by
Dr Horton Inc
Bought by
Kidder Jacob A
Create a Home Valuation Report for This Property
The Home Valuation Report is an in-depth analysis detailing your home's value as well as a comparison with similar homes in the area
Home Values in the Area
Average Home Value in this Area
Purchase History
| Date | Buyer | Sale Price | Title Company |
|---|---|---|---|
| Lage Nataliya | -- | None Available | |
| Lage Nataliya | -- | Fidelity National Ttl Ins Co | |
| Kidder Jacob A | -- | Stewart Title | |
| Kidder Jacob A | $161,422 | Fidelity Nat L Title Ins Co |
Source: Public Records
Mortgage History
| Date | Status | Borrower | Loan Amount |
|---|---|---|---|
| Open | Lage Nataliya | $125,000 | |
| Previous Owner | Kidder Jacob A | $127,500 |
Source: Public Records
Tax History Compared to Growth
Tax History
| Year | Tax Paid | Tax Assessment Tax Assessment Total Assessment is a certain percentage of the fair market value that is determined by local assessors to be the total taxable value of land and additions on the property. | Land | Improvement |
|---|---|---|---|---|
| 2025 | $3,027 | $86,500 | $12,566 | $73,934 |
| 2024 | $2,980 | $83,981 | $11,223 | $72,758 |
| 2023 | $2,980 | $81,535 | $10,000 | $71,535 |
| 2022 | $2,893 | $79,160 | $10,000 | $69,160 |
| 2021 | $1,703 | $51,571 | $10,000 | $41,571 |
| 2020 | $1,647 | $50,069 | $0 | $0 |
| 2019 | $1,603 | $48,611 | $0 | $0 |
| 2018 | $1,457 | $47,195 | $0 | $0 |
| 2017 | $1,391 | $45,821 | $0 | $0 |
| 2016 | $1,558 | $45,821 | $0 | $0 |
| 2014 | $1,546 | $46,868 | $0 | $0 |
| 2013 | -- | $40,868 | $10,000 | $30,868 |
Source: Public Records
Map
Nearby Homes
- 1324 Desert Paintbrush Loop NE
- 1105 Desert Paintbrush Loop
- 1028 Desert Paintbrush Loop
- 0 Valmont (U21 B26 L8 9) Ct NE
- 1047 Desert Willow Place NE
- 3818 Desert Pinon Dr NE
- 0 Reyado (U21 B27 L15 16) Ct NE
- 0 Annabelle (U21 B40 L6) Rd NE
- 0 Bernice (U21 B41 L16) Rd NE Unit 1070535
- 4002 Paxton Ct NE
- 3804 Tranquil Meadows Dr NE
- 1408 Bernice Rd NE
- 2 lots Joyce Rd NE
- 0 Carolyn (U21 B43 L45) St NE Unit 1070527
- 4405 Diane St NE
- 721 Playful Meadows Cir NE
- 1008 Waterfall Dr NE
- 3536 Clear Creek Place NE
- 0 Bernice (U21 B42 L24 25) Rd NE
- 0 Burgess (U21 B42 L4) Rd NE
- 1312 Desert Paintbrush Loop NE
- 1300 Desert Paintbrush Loop
- 1316 Desert Paintbrush Loop
- 1309 Desert Paintbrush Loop
- 1252 Desert Paintbrush Loop
- 1309 Desert Paintbrush Loop NE
- 1305 Desert Paintbrush Loop NE
- 1248 Desert Paintbrush Loop NE
- 1305 Desert Paintbrush Loop
- 1317 Desert Paintbrush Loop NE
- 1301 Desert Paintbrush Loop
- 1321 Desert Paintbrush Loop NE
- 1251 Desert Paintbrush Loop NE
- 1251 Desert Paintbrush Loop
- 1244 Desert Paintbrush Loop NE
- 1328 Desert Paintbrush Loop
- 1240 Desert Paintbrush Loop
- 4016 Desert Pinon Dr NE
- 4020 Desert Pinon Dr NE
- 4024 Desert Pinon Dr NE