1308 W Oak Ave Unit W Lompoc, CA 93436
West Lompoc NeighborhoodEstimated Value: $526,502 - $627,000
3
Beds
2
Baths
1,248
Sq Ft
$454/Sq Ft
Est. Value
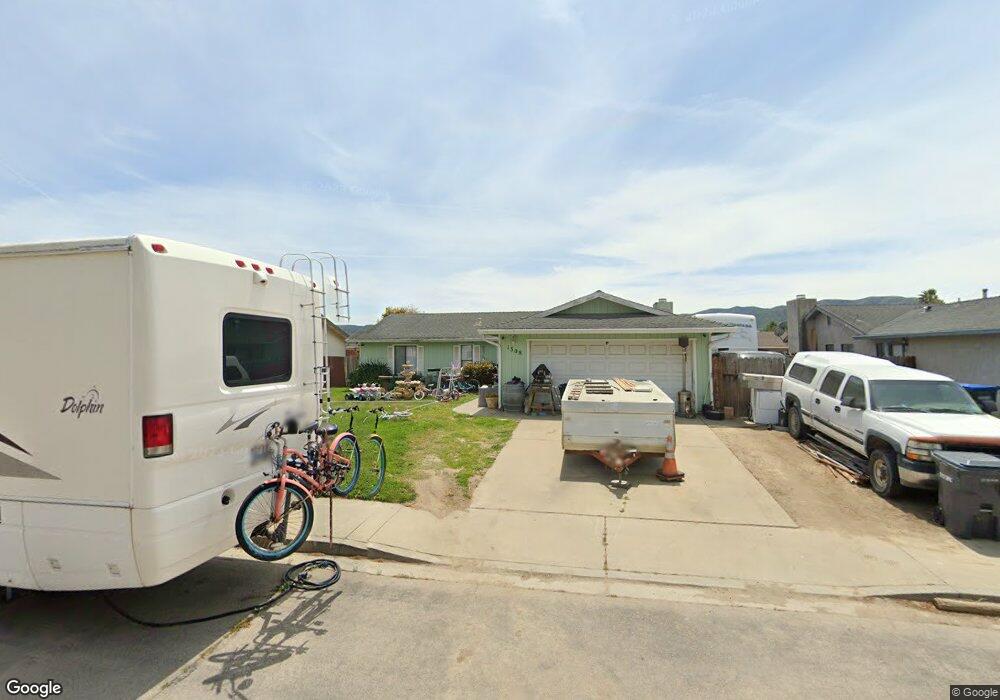
About This Home
This home is located at 1308 W Oak Ave Unit W, Lompoc, CA 93436 and is currently estimated at $566,376, approximately $453 per square foot. 1308 W Oak Ave Unit W is a home located in Santa Barbara County with nearby schools including La Canada Elementary School, Lompoc Valley Middle School, and Lompoc High School.
Ownership History
Date
Name
Owned For
Owner Type
Purchase Details
Closed on
Nov 23, 2011
Sold by
Sanchez Perez Alfredo
Bought by
Robles Agustin and Robles Teresa
Current Estimated Value
Purchase Details
Closed on
Oct 13, 2006
Sold by
Lopez Lilia
Bought by
Sanchez Perez Alfredo
Home Financials for this Owner
Home Financials are based on the most recent Mortgage that was taken out on this home.
Original Mortgage
$79,600
Interest Rate
6.08%
Mortgage Type
Stand Alone Second
Purchase Details
Closed on
Sep 26, 2006
Sold by
Cooper Larry D and Cooper Genevieve O
Bought by
Sanchez Perez Alfredo
Home Financials for this Owner
Home Financials are based on the most recent Mortgage that was taken out on this home.
Original Mortgage
$79,600
Interest Rate
6.08%
Mortgage Type
Stand Alone Second
Create a Home Valuation Report for This Property
The Home Valuation Report is an in-depth analysis detailing your home's value as well as a comparison with similar homes in the area
Home Values in the Area
Average Home Value in this Area
Purchase History
| Date | Buyer | Sale Price | Title Company |
|---|---|---|---|
| Robles Agustin | $168,000 | Fidelity National Title Co | |
| Sanchez Perez Alfredo | -- | United General Title Ins Co | |
| Sanchez Perez Alfredo | $398,000 | United General Title Ins Co |
Source: Public Records
Mortgage History
| Date | Status | Borrower | Loan Amount |
|---|---|---|---|
| Previous Owner | Sanchez Perez Alfredo | $79,600 | |
| Previous Owner | Sanchez Perez Alfredo | $318,400 |
Source: Public Records
Tax History Compared to Growth
Tax History
| Year | Tax Paid | Tax Assessment Tax Assessment Total Assessment is a certain percentage of the fair market value that is determined by local assessors to be the total taxable value of land and additions on the property. | Land | Improvement |
|---|---|---|---|---|
| 2025 | $2,326 | $211,005 | $87,918 | $123,087 |
| 2023 | $2,326 | $202,813 | $84,505 | $118,308 |
| 2022 | $2,285 | $198,838 | $82,849 | $115,989 |
| 2021 | $2,309 | $194,940 | $81,225 | $113,715 |
| 2020 | $2,285 | $192,942 | $80,393 | $112,549 |
| 2019 | $2,247 | $189,160 | $78,817 | $110,343 |
| 2018 | $2,212 | $185,452 | $77,272 | $108,180 |
| 2017 | $2,172 | $181,816 | $75,757 | $106,059 |
| 2016 | $2,133 | $178,252 | $74,272 | $103,980 |
| 2014 | $2,087 | $172,137 | $71,724 | $100,413 |
Source: Public Records
Map
Nearby Homes
- 1036 Armstrong St Unit III
- 1212 W Prune Ave
- 906 N P St
- 1006 Tranquillion Ct
- 816 N O St Unit 113
- 1426 Plum Ave
- 1429 Glen Ellen Ln
- 531 N O St
- 500 N Z St
- 1236 Jason Dr
- 1104 Honda Way
- 905 N L St
- 1317 N V St Unit 182
- 1317 N V St Unit 76
- 1121 Bellflower Ln
- 309 N V St
- 1213 Meridian Way
- 321 W North Ave Unit 49
- 1265 Stonebrook Dr
- 1241 Stonebrook Dr