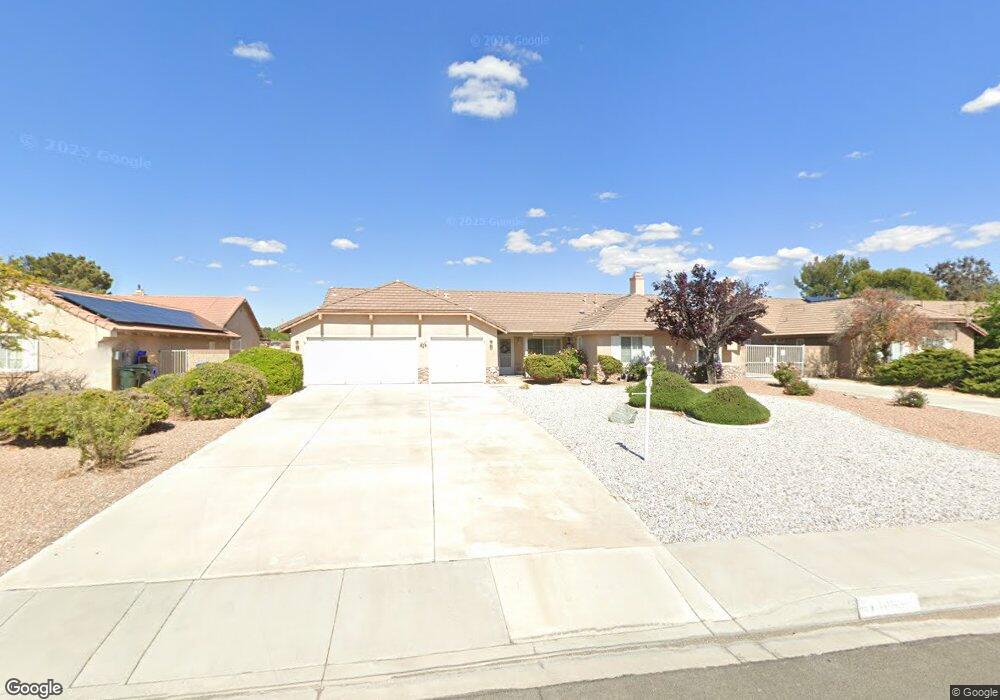
13083 Paraiso Rd Apple Valley, CA 92308
High Desert NeighborhoodEstimated Value: $515,000 - $645,000
4
Beds
3
Baths
2,446
Sq Ft
$236/Sq Ft
Est. Value
About This Home
This home is located at 13083 Paraiso Rd, Apple Valley, CA 92308 and is currently estimated at $577,210, approximately $235 per square foot. 13083 Paraiso Rd is a home located in San Bernardino County with nearby schools including Sitting Bull Academy, Apple Valley High School, and Excelsior Charter School.
Ownership History
Date
Name
Owned For
Owner Type
Purchase Details
Closed on
Feb 3, 2012
Sold by
Stueland Carolyn J
Bought by
Stueland Carolyn J and Stueland Trust
Current Estimated Value
Home Financials for this Owner
Home Financials are based on the most recent Mortgage that was taken out on this home.
Original Mortgage
$102,000
Outstanding Balance
$69,761
Interest Rate
3.93%
Mortgage Type
New Conventional
Estimated Equity
$507,449
Purchase Details
Closed on
Jan 12, 2012
Sold by
Stueland Carolyn J and Stueland Robert R
Bought by
Stueland Carolyn J
Home Financials for this Owner
Home Financials are based on the most recent Mortgage that was taken out on this home.
Original Mortgage
$102,000
Outstanding Balance
$69,761
Interest Rate
3.93%
Mortgage Type
New Conventional
Estimated Equity
$507,449
Purchase Details
Closed on
Jun 26, 1998
Sold by
Stueland Robert R and Stueland Carolyn J
Bought by
Stueland Robert R and Stueland Carolyn J
Purchase Details
Closed on
Dec 5, 1994
Sold by
Lnc Properties Ltd #24
Bought by
Stueland Robert R and Stueland Carolyn J
Home Financials for this Owner
Home Financials are based on the most recent Mortgage that was taken out on this home.
Original Mortgage
$124,750
Interest Rate
7%
Create a Home Valuation Report for This Property
The Home Valuation Report is an in-depth analysis detailing your home's value as well as a comparison with similar homes in the area
Home Values in the Area
Average Home Value in this Area
Purchase History
| Date | Buyer | Sale Price | Title Company |
|---|---|---|---|
| Stueland Carolyn J | -- | None Available | |
| Stueland Carolyn J | -- | Netco Title | |
| Stueland Robert R | -- | -- | |
| Stueland Robert R | $156,000 | First American Title Ins Co |
Source: Public Records
Mortgage History
| Date | Status | Borrower | Loan Amount |
|---|---|---|---|
| Open | Stueland Carolyn J | $102,000 | |
| Previous Owner | Stueland Robert R | $124,750 |
Source: Public Records
Tax History
| Year | Tax Paid | Tax Assessment Tax Assessment Total Assessment is a certain percentage of the fair market value that is determined by local assessors to be the total taxable value of land and additions on the property. | Land | Improvement |
|---|---|---|---|---|
| 2025 | $1,140 | $82,576 | $12,346 | $70,230 |
| 2024 | $1,112 | $80,957 | $12,104 | $68,853 |
| 2023 | $1,101 | $79,370 | $11,867 | $67,503 |
| 2022 | $1,084 | $77,813 | $11,634 | $66,179 |
| 2021 | $1,062 | $76,287 | $11,406 | $64,881 |
| 2020 | $1,049 | $75,505 | $11,289 | $64,216 |
| 2019 | $1,031 | $74,025 | $11,068 | $62,957 |
| 2018 | $1,008 | $72,574 | $10,851 | $61,723 |
| 2017 | $994 | $71,151 | $10,638 | $60,513 |
| 2016 | $921 | $69,755 | $10,429 | $59,326 |
| 2015 | $909 | $68,707 | $10,272 | $58,435 |
| 2014 | $896 | $67,361 | $10,071 | $57,290 |
Source: Public Records
Map
Nearby Homes
- 12971 Lompoc Rd
- 13114 Choco Rd
- 12925 Davona Dale Rd
- 13288 Choco Rd
- 13167 Olathe Rd
- 13195 Trailwood Way
- 13311 Choco Rd
- 19274 Kanbridge St
- 19265 Kanbridge St
- 23766 Valley View Ct
- 19262 Monterey St
- 19783 Lara Ln
- 12720 Yorkshire Dr
- 19185 Cochise Place
- 12840 Mar Vista Dr
- 19978 Eyota Rd
- 13519 Sunset Dr
- 13262 Cuyamaca Rd
- 13250 Ivanpah Rd
- 12690 Mar Vista Dr
- 13091 Paraiso Rd
- 13077 Paraiso Rd
- 13061 Paraiso Rd
- 13117 Paraiso Rd
- 13096 Lompoc Rd
- 19551 Capay Ct
- 13043 Paraiso Rd
- 13135 Paraiso Rd
- 13060 Paraiso Rd
- 13080 Lompoc Rd
- 0 Paraiso Rd
- 13042 Paraiso Rd
- 13155 Paraiso Rd
- 13027 Paraiso Rd
- 19531 Capay Ct
- 13066 Lompoc Rd
- 13026 Paraiso Rd
- 19540 Capay Ct
- 0 Via Paraiso Rd Unit IV16063481
- 0 Via Paraiso Rd Unit 380737
Your Personal Tour Guide
Ask me questions while you tour the home.