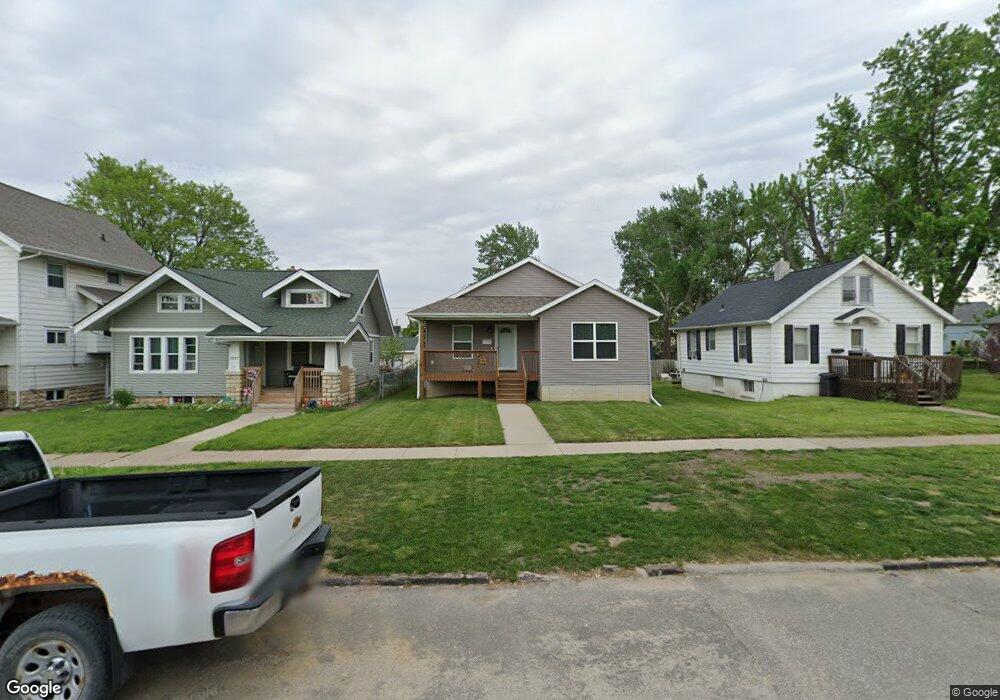
1309 3rd St SW Cedar Rapids, IA 52404
Taylor NeighborhoodEstimated Value: $196,000 - $219,000
3
Beds
3
Baths
1,250
Sq Ft
$169/Sq Ft
Est. Value
About This Home
This home is located at 1309 3rd St SW, Cedar Rapids, IA 52404 and is currently estimated at $210,807, approximately $168 per square foot. 1309 3rd St SW is a home with nearby schools including Cedar River Academy at Taylor Elementary School, Wilson Middle School, and Thomas Jefferson High School.
Ownership History
Date
Name
Owned For
Owner Type
Purchase Details
Closed on
Aug 28, 2014
Sold by
Cedar Ridge Homes Inc
Bought by
Stevens Ian
Current Estimated Value
Home Financials for this Owner
Home Financials are based on the most recent Mortgage that was taken out on this home.
Original Mortgage
$112,500
Outstanding Balance
$86,031
Interest Rate
4.11%
Mortgage Type
New Conventional
Estimated Equity
$124,776
Purchase Details
Closed on
Mar 7, 2011
Sold by
Nemec John L
Bought by
City Of Cedar Rapids
Purchase Details
Closed on
Jan 26, 2011
Sold by
Nemec Richard A and Zamastil Nemec Julie May
Bought by
Nemec John L
Create a Home Valuation Report for This Property
The Home Valuation Report is an in-depth analysis detailing your home's value as well as a comparison with similar homes in the area
Home Values in the Area
Average Home Value in this Area
Purchase History
| Date | Buyer | Sale Price | Title Company |
|---|---|---|---|
| Stevens Ian | $150,000 | None Available | |
| City Of Cedar Rapids | $62,500 | None Available | |
| Nemec John L | -- | None Available |
Source: Public Records
Mortgage History
| Date | Status | Borrower | Loan Amount |
|---|---|---|---|
| Open | Stevens Ian | $112,500 |
Source: Public Records
Tax History
| Year | Tax Paid | Tax Assessment Tax Assessment Total Assessment is a certain percentage of the fair market value that is determined by local assessors to be the total taxable value of land and additions on the property. | Land | Improvement |
|---|---|---|---|---|
| 2025 | $2,910 | $222,500 | $23,900 | $198,600 |
| 2024 | $3,336 | $194,900 | $20,800 | $174,100 |
| 2023 | $3,336 | $174,900 | $20,800 | $154,100 |
| 2022 | $3,138 | $167,000 | $20,800 | $146,200 |
| 2021 | $3,020 | $160,400 | $18,700 | $141,700 |
| 2020 | $3,020 | $145,500 | $18,700 | $126,800 |
| 2019 | $2,842 | $140,400 | $14,600 | $125,800 |
Source: Public Records
Map
Nearby Homes
Your Personal Tour Guide
Ask me questions while you tour the home.