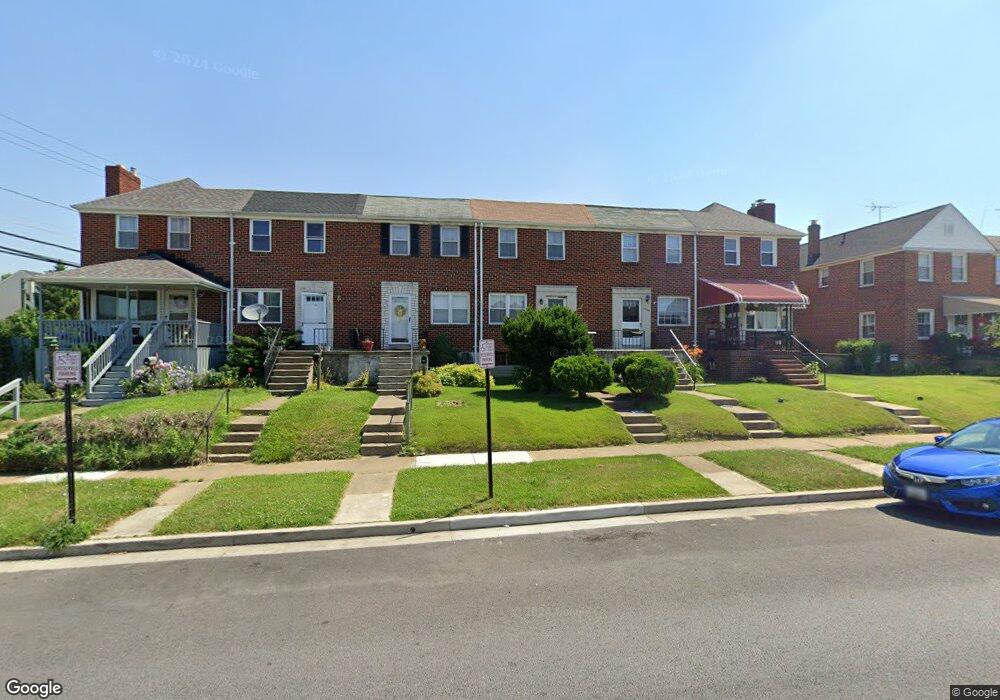
1309 Delvale Ave Dundalk, MD 21222
Estimated Value: $198,730 - $246,000
3
Beds
2
Baths
1,120
Sq Ft
$198/Sq Ft
Est. Value
About This Home
This home is located at 1309 Delvale Ave, Dundalk, MD 21222 and is currently estimated at $222,183, approximately $198 per square foot. 1309 Delvale Ave is a home located in Baltimore County with nearby schools including Norwood Elementary School, Holabird Middle School, and Dundalk High School.
Ownership History
Date
Name
Owned For
Owner Type
Purchase Details
Closed on
Aug 25, 2011
Sold by
C & G Commercial Realty Llc
Bought by
Herring Lori Ann and Herring William J
Current Estimated Value
Home Financials for this Owner
Home Financials are based on the most recent Mortgage that was taken out on this home.
Original Mortgage
$126,704
Outstanding Balance
$87,565
Interest Rate
4.53%
Mortgage Type
FHA
Estimated Equity
$134,618
Purchase Details
Closed on
Aug 15, 2011
Sold by
C & G Commercial Realty Llc
Bought by
Herring Lori Ann and Herring William J
Home Financials for this Owner
Home Financials are based on the most recent Mortgage that was taken out on this home.
Original Mortgage
$126,704
Outstanding Balance
$87,565
Interest Rate
4.53%
Mortgage Type
FHA
Estimated Equity
$134,618
Purchase Details
Closed on
Nov 9, 1998
Sold by
Greeley Christian J
Bought by
Falkenstein Angela M
Create a Home Valuation Report for This Property
The Home Valuation Report is an in-depth analysis detailing your home's value as well as a comparison with similar homes in the area
Home Values in the Area
Average Home Value in this Area
Purchase History
| Date | Buyer | Sale Price | Title Company |
|---|---|---|---|
| Herring Lori Ann | $130,000 | -- | |
| Herring Lori Ann | $130,000 | -- | |
| Herring Lori Ann | $130,000 | -- | |
| Herring Lori Ann | $130,000 | -- | |
| Falkenstein Angela M | $76,500 | -- |
Source: Public Records
Mortgage History
| Date | Status | Borrower | Loan Amount |
|---|---|---|---|
| Open | Herring Lori Ann | $126,704 | |
| Closed | Herring Lori Ann | $126,704 |
Source: Public Records
Tax History Compared to Growth
Tax History
| Year | Tax Paid | Tax Assessment Tax Assessment Total Assessment is a certain percentage of the fair market value that is determined by local assessors to be the total taxable value of land and additions on the property. | Land | Improvement |
|---|---|---|---|---|
| 2025 | $2,413 | $162,367 | -- | -- |
| 2024 | $2,413 | $147,333 | $0 | $0 |
| 2023 | $1,162 | $132,300 | $36,000 | $96,300 |
| 2022 | $2,234 | $129,200 | $0 | $0 |
| 2021 | $2,113 | $126,100 | $0 | $0 |
| 2020 | $2,113 | $123,000 | $36,000 | $87,000 |
| 2019 | $1,994 | $123,000 | $36,000 | $87,000 |
| 2018 | $2,052 | $123,000 | $36,000 | $87,000 |
| 2017 | $1,960 | $124,800 | $0 | $0 |
| 2016 | $2,095 | $120,967 | $0 | $0 |
| 2015 | $2,095 | $117,133 | $0 | $0 |
| 2014 | $2,095 | $113,300 | $0 | $0 |
Source: Public Records
Map
Nearby Homes
- 1404 Delvale Ave
- 1301 Delbert Ave
- 6817 Duluth Ave
- 6824 Boston Ave
- 6820 Bessemer Ave
- 6816 Boston Ave
- 638 Villager Cir
- 1214 S 48th St
- 6736 Bessemer Ave
- 6728 Boston Ave
- 6736 Graceland Ave
- 6707 1/2 Gary Ave
- 6705 Gary Ave
- 6609 Graceland Ave
- 1807 Snyder Ave
- 6701 Duluth Ave
- 570 47th St
- 6715 Fait Ave
- 6609 Bushey St
- 7128 Crestshire Rd
- 1307 Delvale Ave
- 1311 Delvale Ave
- 1305 Delvale Ave
- 1313 Delvale Ave
- 1303 Delvale Ave
- 1315 Delvale Ave
- 1317 Delvale Ave
- 1301 Delvale Ave
- 1319 Delvale Ave
- 1321 Delvale Ave
- 1323 Delvale Ave
- 1325 Delvale Ave
- 1327 Delvale Ave
- 1308 Delvale Ave
- 1310 Delvale Ave
- 1306 Delvale Ave
- 1304 Delvale Ave
- 1312 Delvale Ave
- 1302 Delvale Ave
- 6809 Redrose Way