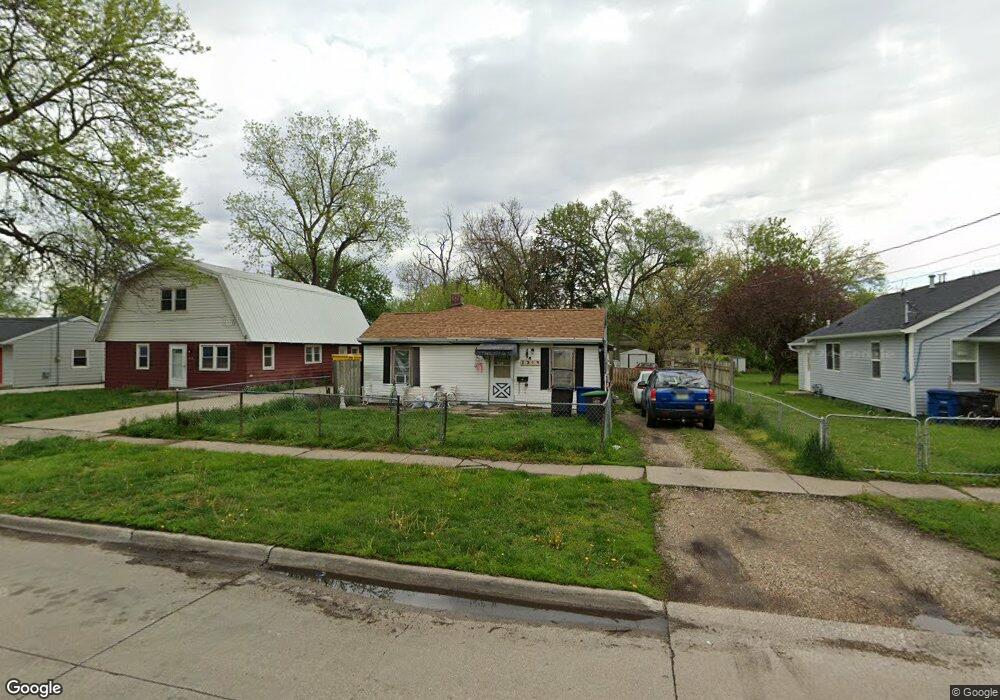
1309 E 26th St Des Moines, IA 50317
Drake NeighborhoodEstimated Value: $116,480 - $238,000
2
Beds
1
Bath
726
Sq Ft
$214/Sq Ft
Est. Value
About This Home
This home is located at 1309 E 26th St, Des Moines, IA 50317 and is currently estimated at $155,620, approximately $214 per square foot. 1309 E 26th St is a home located in Polk County with nearby schools including Perkins Elementary School and Roosevelt High School.
Ownership History
Date
Name
Owned For
Owner Type
Purchase Details
Closed on
Aug 10, 2006
Sold by
Phipps Jerry Lee
Bought by
Thompson Melvin E and Thompson Joyce
Current Estimated Value
Home Financials for this Owner
Home Financials are based on the most recent Mortgage that was taken out on this home.
Original Mortgage
$56,100
Outstanding Balance
$33,544
Interest Rate
6.78%
Mortgage Type
Purchase Money Mortgage
Estimated Equity
$122,076
Purchase Details
Closed on
Aug 3, 2005
Sold by
Phipps Marihuana Lee
Bought by
Phipps Jerry Lee
Create a Home Valuation Report for This Property
The Home Valuation Report is an in-depth analysis detailing your home's value as well as a comparison with similar homes in the area
Home Values in the Area
Average Home Value in this Area
Purchase History
| Date | Buyer | Sale Price | Title Company |
|---|---|---|---|
| Thompson Melvin E | $19,500 | None Available | |
| Phipps Jerry Lee | -- | -- |
Source: Public Records
Mortgage History
| Date | Status | Borrower | Loan Amount |
|---|---|---|---|
| Open | Thompson Melvin E | $56,100 |
Source: Public Records
Tax History Compared to Growth
Tax History
| Year | Tax Paid | Tax Assessment Tax Assessment Total Assessment is a certain percentage of the fair market value that is determined by local assessors to be the total taxable value of land and additions on the property. | Land | Improvement |
|---|---|---|---|---|
| 2025 | $926 | $72,200 | $30,300 | $41,900 |
| 2024 | $926 | $64,600 | $26,600 | $38,000 |
| 2023 | $1,064 | $64,600 | $26,600 | $38,000 |
| 2022 | $1,054 | $54,000 | $22,100 | $31,900 |
| 2021 | $1,028 | $54,000 | $22,100 | $31,900 |
| 2020 | $1,062 | $49,800 | $20,200 | $29,600 |
| 2019 | $1,328 | $49,800 | $20,200 | $29,600 |
| 2018 | $1,308 | $57,900 | $17,800 | $40,100 |
| 2017 | $1,282 | $57,900 | $17,800 | $40,100 |
| 2016 | $1,244 | $55,900 | $16,800 | $39,100 |
| 2015 | $1,244 | $55,900 | $16,800 | $39,100 |
| 2014 | $1,182 | $55,100 | $16,300 | $38,800 |
Source: Public Records
Map
Nearby Homes
- 1136 26th St
- 2303 Carpenter Ave
- 1318 23rd St
- 1132 26th St
- 1131 28th St
- 1107 24th St
- 1120 23rd St Unit 6
- 1303 22nd St
- 2305 Drake Park Ave
- 2126 University Ave
- 2814 Rutland Ave
- 1070 22nd St
- 1175 21st St
- 1557 27th St
- 2609 School St
- 1559 23rd St
- 1012 28th St
- 3101 Cottage Grove Ave
- 1519 30th St
- 1434 Martin Luther King Junior Pkwy
- 2515 University Ave Unit ID1036850P
- 2509 University Ave Unit ID1036854P
- 1211 25th St Unit ID1036851P
- 1211 25th St Unit ID1036859P
- 0 Tbd St Unit 613323
- 1203 25th St Unit ID1036856P
- 1203 25th St Unit ID1036858P
- 2507 University Ave Unit ID1036809P
- 2507 University Ave Unit ID1036855P
- 1201 25th St Unit ID1036858P
- 1201 25th St Unit ID1036856P
- 1337 27th St
- 1341 27th St
- 2530 University Ave Unit ID1036859P
- 2530 University Ave Unit ID1036853P
- 2530 University Ave Unit ID1036850P
- 2530 University Ave Unit ID1036856P
- 2530 University Ave Unit ID1036858P
- 2530 University Ave Unit ID1036855P
- 2530 University Ave Unit ID1036851P