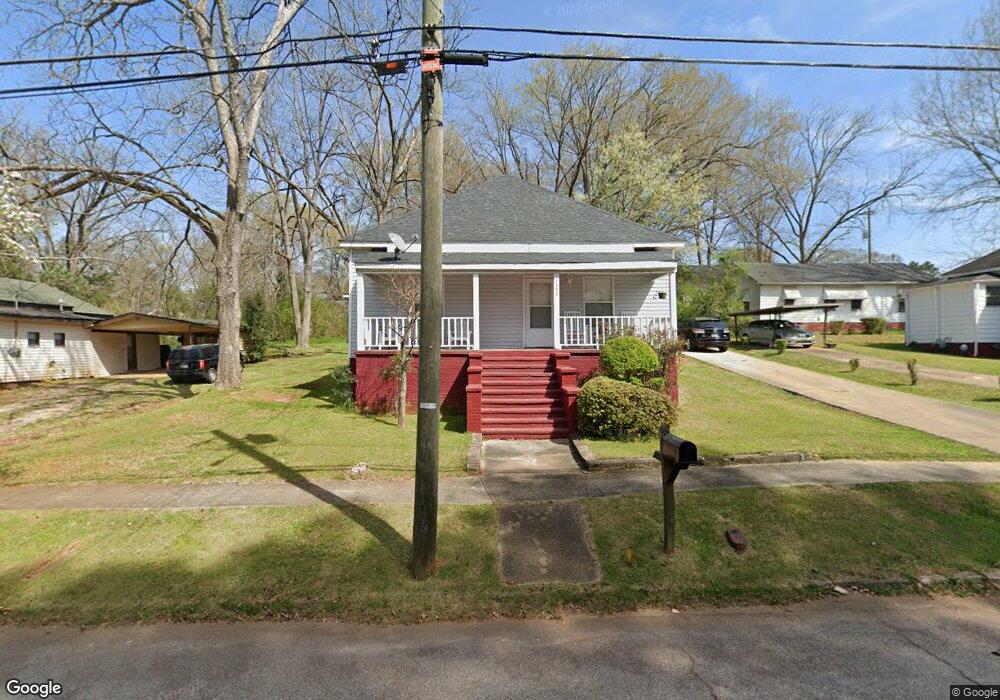
1309 Elm St Lagrange, GA 30240
Estimated Value: $103,000 - $134,000
2
Beds
2
Baths
1,136
Sq Ft
$108/Sq Ft
Est. Value
About This Home
This home is located at 1309 Elm St, Lagrange, GA 30240 and is currently estimated at $122,415, approximately $107 per square foot. 1309 Elm St is a home located in Troup County with nearby schools including Berta Weathersbee Elementary School, Whitesville Road Elementary School, and Rosemont Elementary School.
Ownership History
Date
Name
Owned For
Owner Type
Purchase Details
Closed on
Dec 18, 2009
Sold by
Taylor Phillip Anthony
Bought by
Bailey Adrian H
Current Estimated Value
Home Financials for this Owner
Home Financials are based on the most recent Mortgage that was taken out on this home.
Original Mortgage
$50,000
Outstanding Balance
$32,479
Interest Rate
4.82%
Mortgage Type
New Conventional
Estimated Equity
$89,936
Purchase Details
Closed on
Sep 7, 2004
Sold by
Brown Tim
Bought by
Taylor Phillip Anthony
Purchase Details
Closed on
Jan 3, 2003
Sold by
Taylor Phil
Bought by
Brown Tim
Purchase Details
Closed on
Nov 7, 1997
Sold by
Mozelle Fincher White
Bought by
Taylor Phil
Purchase Details
Closed on
Jan 1, 1972
Bought by
Mozelle Fincher White
Purchase Details
Closed on
Jan 1, 1952
Sold by
Callaway Comm Fdn
Create a Home Valuation Report for This Property
The Home Valuation Report is an in-depth analysis detailing your home's value as well as a comparison with similar homes in the area
Home Values in the Area
Average Home Value in this Area
Purchase History
| Date | Buyer | Sale Price | Title Company |
|---|---|---|---|
| Bailey Adrian H | $50,000 | -- | |
| Bailey Adrian H | $50,000 | -- | |
| Taylor Phillip Anthony | -- | -- | |
| Brown Tim | $62,000 | -- | |
| Taylor Phil | $10,000 | -- | |
| Mozelle Fincher White | -- | -- | |
| -- | -- | -- |
Source: Public Records
Mortgage History
| Date | Status | Borrower | Loan Amount |
|---|---|---|---|
| Open | Bailey Adrian H | $50,000 | |
| Closed | Bailey Adrian H | $50,000 |
Source: Public Records
Tax History Compared to Growth
Tax History
| Year | Tax Paid | Tax Assessment Tax Assessment Total Assessment is a certain percentage of the fair market value that is determined by local assessors to be the total taxable value of land and additions on the property. | Land | Improvement |
|---|---|---|---|---|
| 2024 | $722 | $26,480 | $3,240 | $23,240 |
| 2023 | $669 | $24,520 | $3,240 | $21,280 |
| 2022 | $651 | $23,320 | $3,240 | $20,080 |
| 2021 | $592 | $19,640 | $3,240 | $16,400 |
| 2020 | $592 | $19,640 | $3,240 | $16,400 |
| 2019 | $548 | $18,160 | $3,240 | $14,920 |
| 2018 | $546 | $18,120 | $3,200 | $14,920 |
| 2017 | $547 | $18,120 | $3,200 | $14,920 |
| 2016 | $531 | $17,612 | $3,200 | $14,412 |
| 2015 | $532 | $17,612 | $3,200 | $14,412 |
| 2014 | $556 | $18,373 | $3,200 | $15,173 |
| 2013 | -- | $19,522 | $3,200 | $16,322 |
Source: Public Records
Map
Nearby Homes