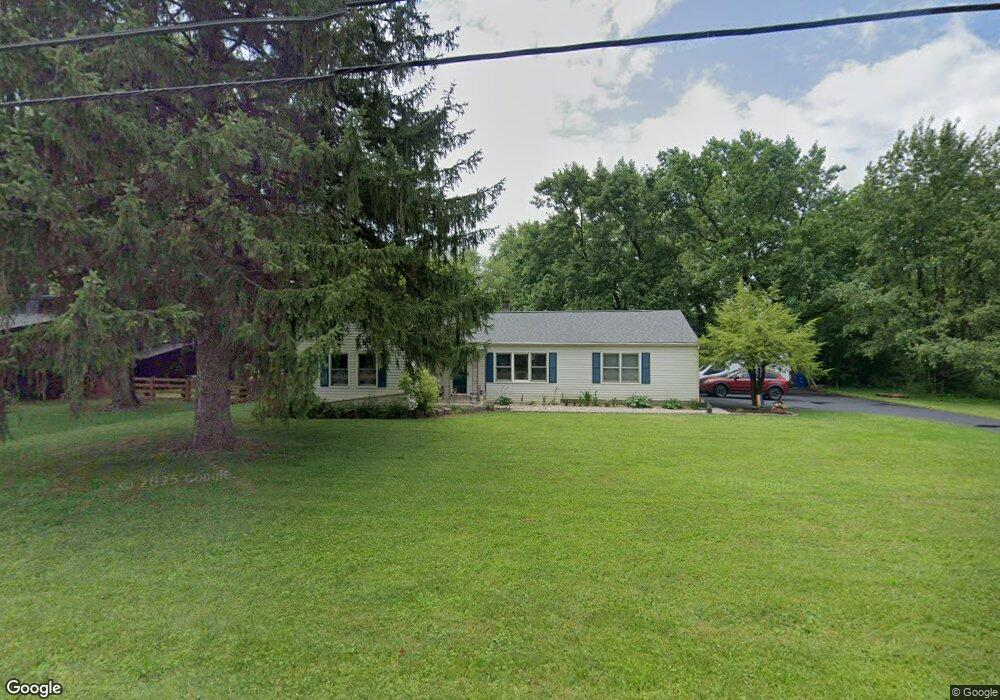
1309 Francisco Rd Columbus, OH 43220
Knolls West NeighborhoodEstimated Value: $336,000 - $381,000
3
Beds
2
Baths
1,166
Sq Ft
$308/Sq Ft
Est. Value
About This Home
This home is located at 1309 Francisco Rd, Columbus, OH 43220 and is currently estimated at $359,355, approximately $308 per square foot. 1309 Francisco Rd is a home located in Franklin County with nearby schools including Winterset Elementary School, Ridgeview Middle School, and Centennial High School.
Ownership History
Date
Name
Owned For
Owner Type
Purchase Details
Closed on
Apr 20, 2021
Sold by
Wallace Ronald F and Wallace Judith S
Bought by
Mcfarland Amy
Current Estimated Value
Home Financials for this Owner
Home Financials are based on the most recent Mortgage that was taken out on this home.
Original Mortgage
$257,050
Outstanding Balance
$232,085
Interest Rate
3%
Mortgage Type
New Conventional
Estimated Equity
$127,270
Purchase Details
Closed on
Jul 14, 2005
Sold by
Gunnin John C
Bought by
Ameser Rachel and Ameser Rachel M
Purchase Details
Closed on
Oct 7, 1993
Bought by
Wallace Ronald F
Purchase Details
Closed on
May 1, 1984
Create a Home Valuation Report for This Property
The Home Valuation Report is an in-depth analysis detailing your home's value as well as a comparison with similar homes in the area
Home Values in the Area
Average Home Value in this Area
Purchase History
| Date | Buyer | Sale Price | Title Company |
|---|---|---|---|
| Mcfarland Amy | $265,000 | Valmer Land Title Agency Llc | |
| Ameser Rachel | $230,000 | Title First | |
| Wallace Ronald F | -- | -- | |
| -- | $68,000 | -- |
Source: Public Records
Mortgage History
| Date | Status | Borrower | Loan Amount |
|---|---|---|---|
| Open | Mcfarland Amy | $257,050 |
Source: Public Records
Tax History Compared to Growth
Tax History
| Year | Tax Paid | Tax Assessment Tax Assessment Total Assessment is a certain percentage of the fair market value that is determined by local assessors to be the total taxable value of land and additions on the property. | Land | Improvement |
|---|---|---|---|---|
| 2024 | $3,488 | $76,100 | $23,280 | $52,820 |
| 2023 | $3,594 | $76,100 | $23,280 | $52,820 |
| 2022 | $3,902 | $70,600 | $29,090 | $41,510 |
| 2021 | $3,759 | $70,600 | $29,090 | $41,510 |
| 2020 | $3,914 | $70,600 | $29,090 | $41,510 |
| 2019 | $3,483 | $56,010 | $23,280 | $32,730 |
| 2018 | $3,310 | $56,010 | $23,280 | $32,730 |
| 2017 | $3,490 | $56,010 | $23,280 | $32,730 |
| 2016 | $3,448 | $50,020 | $23,590 | $26,430 |
| 2015 | $3,144 | $50,020 | $23,590 | $26,430 |
| 2014 | $3,101 | $50,020 | $23,590 | $26,430 |
| 2013 | $1,581 | $50,295 | $22,470 | $27,825 |
Source: Public Records
Map
Nearby Homes
- 1466 Weybridge Rd
- 4818 -4820 Winterset Dr
- 4925-4927 Godown Rd
- 4878 Arthur Place
- 4692 Charecote Ln Unit E
- 1147 Langland Dr
- 1558 Denbigh Dr
- 1161 Bethel Rd Unit 103/104
- 4714-4716 Arthur Ct
- 5018 Paula Ct
- 1022 Galliton Ct Unit C
- 1075 Merrimar Cir N Unit B
- 1046 Merrimar Cir N Unit B
- 1030 Galliton Ct Unit B
- 4655 Merrimar Cir E Unit E
- 1424 Havencrest Ct
- 4793 Teter Ct
- 1415 Reymond Rd
- 4924 Reed Rd Unit B
- 1470 Slade Ave Unit 204
- 1299 Francisco Rd
- 1340 Weybridge Rd Unit 342
- 1340 Weybridge Rd Unit 1340 & 1342
- 1328 Weybridge Rd Unit 330
- 1273 Francisco Rd
- 1356 Weybridge Rd Unit 358
- 1320 Weybridge Rd Unit 322
- 1312 Francisco Rd
- 1302 Francisco Rd
- 1364 Weybridge Rd Unit 366
- 1312 Weybridge Rd Unit 314
- 1320 Francisco Rd
- 1292 Francisco Rd
- 1374 Weybridge Rd Unit 376
- 1334 Francisco Rd
- 1304 Weybridge Rd Unit 306
- 1255 Francisco Rd
- 1296 Weybridge Rd Unit 298
- 1296-1298 Weybridge Rd
- 1348 Francisco Rd