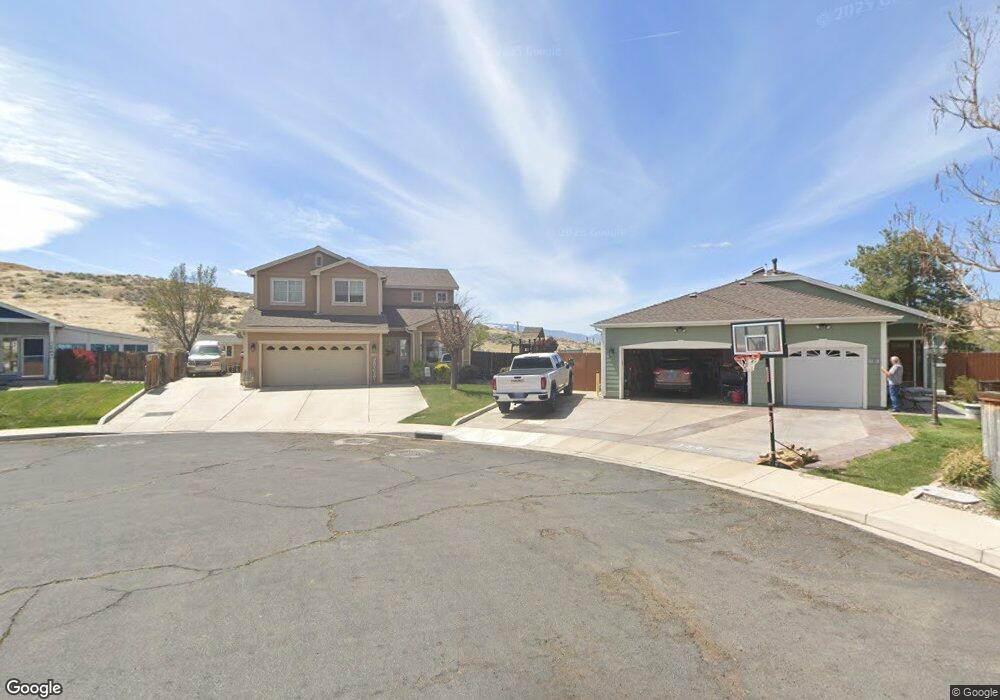
1309 Spade Bit Ct Sparks, NV 89434
Reed NeighborhoodEstimated Value: $553,516 - $650,000
4
Beds
3
Baths
2,333
Sq Ft
$264/Sq Ft
Est. Value
About This Home
This home is located at 1309 Spade Bit Ct, Sparks, NV 89434 and is currently estimated at $614,879, approximately $263 per square foot. 1309 Spade Bit Ct is a home located in Washoe County with nearby schools including Jerry Whitehead Elementary School, Lou Mendive Middle School, and Edward C Reed High School.
Ownership History
Date
Name
Owned For
Owner Type
Purchase Details
Closed on
Oct 7, 2019
Sold by
Pine Christopher J and Pine Amy L
Bought by
Pine Amy L and Pine Christopher J
Current Estimated Value
Home Financials for this Owner
Home Financials are based on the most recent Mortgage that was taken out on this home.
Original Mortgage
$304,000
Outstanding Balance
$266,319
Interest Rate
3.5%
Mortgage Type
New Conventional
Estimated Equity
$348,560
Purchase Details
Closed on
Feb 20, 2002
Sold by
Shadow Park Homes Llc
Bought by
Pine Christopher J and Pine Amy L
Home Financials for this Owner
Home Financials are based on the most recent Mortgage that was taken out on this home.
Original Mortgage
$210,500
Interest Rate
7.04%
Create a Home Valuation Report for This Property
The Home Valuation Report is an in-depth analysis detailing your home's value as well as a comparison with similar homes in the area
Home Values in the Area
Average Home Value in this Area
Purchase History
| Date | Buyer | Sale Price | Title Company |
|---|---|---|---|
| Pine Amy L | -- | First American Title Ins C | |
| Pine Christopher J | $225,053 | Western Title Inc |
Source: Public Records
Mortgage History
| Date | Status | Borrower | Loan Amount |
|---|---|---|---|
| Open | Pine Amy L | $304,000 | |
| Closed | Pine Christopher J | $210,500 |
Source: Public Records
Tax History Compared to Growth
Tax History
| Year | Tax Paid | Tax Assessment Tax Assessment Total Assessment is a certain percentage of the fair market value that is determined by local assessors to be the total taxable value of land and additions on the property. | Land | Improvement |
|---|---|---|---|---|
| 2025 | $3,132 | $117,193 | $37,926 | $79,267 |
| 2024 | $3,041 | $114,968 | $34,876 | $80,092 |
| 2023 | $3,041 | $112,786 | $36,934 | $75,853 |
| 2022 | $2,953 | $91,219 | $28,077 | $63,142 |
| 2021 | $2,867 | $85,663 | $22,822 | $62,841 |
| 2020 | $2,784 | $84,749 | $21,756 | $62,993 |
| 2019 | $2,702 | $82,621 | $21,756 | $60,865 |
| 2018 | $2,624 | $74,748 | $15,178 | $59,570 |
| 2017 | $2,547 | $74,067 | $14,406 | $59,661 |
| 2016 | $2,482 | $73,757 | $12,863 | $60,894 |
| 2015 | $2,480 | $71,671 | $10,841 | $60,830 |
| 2014 | $2,408 | $67,605 | $9,482 | $58,123 |
| 2013 | -- | $64,371 | $7,203 | $57,168 |
Source: Public Records
Map
Nearby Homes
- 3345 Groom Way
- 1575 Olinghouse St
- 3156 Waterfield Dr
- 3127 Montezuma Way
- 3238 Candelaria Dr
- 1055 Baywood Dr Unit D
- 1051 Baywood Dr Unit A
- 1069 Palmwood Dr
- 3602 Oakridge Dr
- 1040 #87 Baywood Unit C
- 1035 Baywood Dr Unit D
- 1041 Baywood Dr Unit B
- 1031 Vintage Hills Pkwy
- 1029 Baywood Dr Unit D
- 1020 Baywood Dr Unit B
- 1064 Bradley Square
- 1475 Golddust Dr
- 1002 Baywood Dr Unit A
- 1557 Satellite Dr
- 930 Spanish Springs Rd
- 1317 Spade Bit Ct
- 1301 Spade Bit Ct
- 1325 Spade Bit Ct
- 2300 Shadow Ln
- 1333 Spade Bit Ct
- 3455 Shadow Ranch Dr
- 1341 Spade Bit Ct
- 1349 Spade Bit Dr
- 2200 Shadow Ln
- 7645 Country Cir
- 7645 Country Creek Rd
- 1356 Spade Bit Dr
- 1357 Spade Bit Dr
- 3483 Shadow Ranch Dr
- 3482 Shadow Ranch Dr
- 1368 Spade Bit Dr
- 1365 Spade Bit Dr
- 3479 Shadow Cast Ct
- 3498 Shadow Ranch Dr
- 1373 Spade Bit Dr