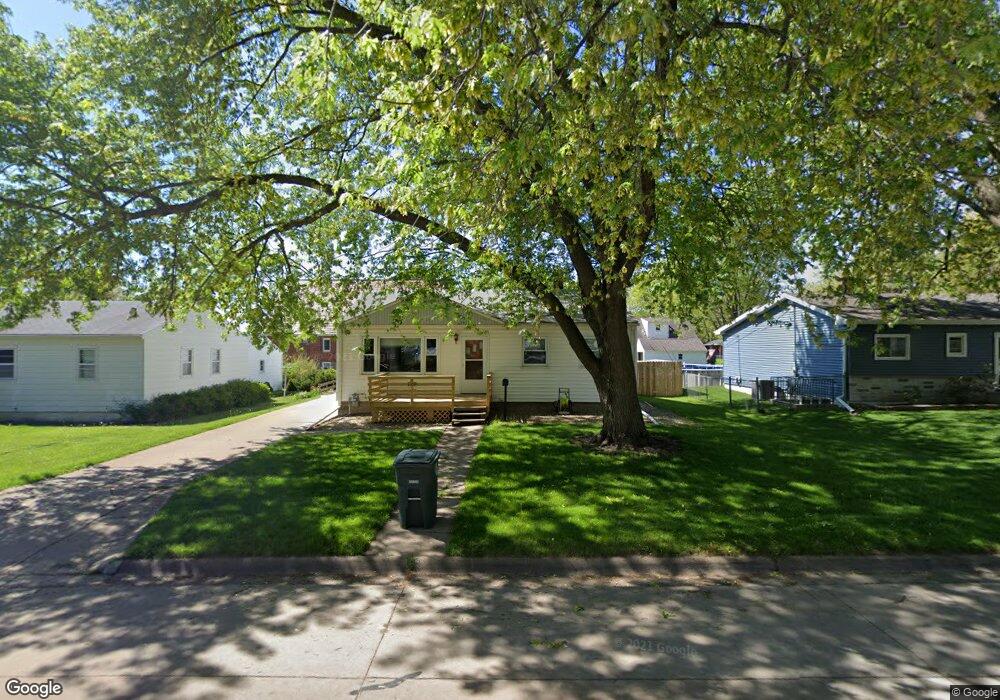
1309 Upton Ave Waterloo, IA 50701
Estimated Value: $125,000 - $155,000
3
Beds
1
Bath
816
Sq Ft
$165/Sq Ft
Est. Value
About This Home
This home is located at 1309 Upton Ave, Waterloo, IA 50701 and is currently estimated at $134,793, approximately $165 per square foot. 1309 Upton Ave is a home located in Black Hawk County with nearby schools including Becker Elementary School, Central Middle School, and East High School.
Ownership History
Date
Name
Owned For
Owner Type
Purchase Details
Closed on
Nov 14, 2011
Sold by
Barker Jeffrey W
Bought by
Banklowa
Current Estimated Value
Home Financials for this Owner
Home Financials are based on the most recent Mortgage that was taken out on this home.
Original Mortgage
$89,587
Outstanding Balance
$60,420
Interest Rate
3.87%
Mortgage Type
FHA
Estimated Equity
$74,373
Purchase Details
Closed on
Apr 29, 2011
Sold by
Ocwen Loan Servicing Llc
Bought by
Dka Properties Inc
Home Financials for this Owner
Home Financials are based on the most recent Mortgage that was taken out on this home.
Original Mortgage
$74,000
Interest Rate
4.86%
Mortgage Type
Credit Line Revolving
Purchase Details
Closed on
Dec 15, 2010
Sold by
Albus Andrea C
Bought by
Be Deutsche Bank National Trust Compan and Be The Registered Holders Of Sonn
Create a Home Valuation Report for This Property
The Home Valuation Report is an in-depth analysis detailing your home's value as well as a comparison with similar homes in the area
Purchase History
| Date | Buyer | Sale Price | Title Company |
|---|---|---|---|
| Banklowa | -- | None Available | |
| Barker Jeffrey W | $92,000 | Black Hawk County Abstract & | |
| Dka Properties Inc | $72,000 | None Available | |
| Be Deutsche Bank National Trust Compan | -- | None Available |
Source: Public Records
Mortgage History
| Date | Status | Borrower | Loan Amount |
|---|---|---|---|
| Open | Barker Jeffrey W | $89,587 | |
| Previous Owner | Dka Properties Inc | $74,000 |
Source: Public Records
Tax History
| Year | Tax Paid | Tax Assessment Tax Assessment Total Assessment is a certain percentage of the fair market value that is determined by local assessors to be the total taxable value of land and additions on the property. | Land | Improvement |
|---|---|---|---|---|
| 2025 | $2,338 | $116,800 | $18,880 | $97,920 |
| 2024 | $2,338 | $117,970 | $18,880 | $99,090 |
| 2023 | $1,896 | $117,970 | $18,880 | $99,090 |
| 2022 | $1,844 | $95,230 | $18,880 | $76,350 |
| 2021 | $1,896 | $95,230 | $18,880 | $76,350 |
| 2020 | $1,832 | $90,980 | $15,970 | $75,010 |
| 2019 | $1,832 | $90,980 | $15,970 | $75,010 |
| 2018 | $1,750 | $87,230 | $15,970 | $71,260 |
| 2017 | $1,750 | $87,230 | $15,970 | $71,260 |
| 2016 | $1,782 | $87,230 | $15,970 | $71,260 |
| 2015 | $1,782 | $87,230 | $15,970 | $71,260 |
| 2014 | $1,816 | $87,230 | $15,970 | $71,260 |
Source: Public Records
Map
Nearby Homes
- 425 Auburn St
- 600 Beverly Hills St
- 819 Hanna Blvd
- 1906 Coachman Dr
- 712 Upton Ave
- 2.29 Acres Ansborough Ave
- 645 Dundee Ave
- 1214 Pleasant Valley Dr
- 320 Valley Rd
- 412 Hughes Dr
- 525 Evergreen Ave
- 516 Upton Ave
- 118 Axlewood Dr
- 124 Axlewood Dr
- 117 Axlewood Dr
- 119 Axlewood Dr
- 608 Wallgate Ave
- 610 Wallgate Ave
- 606 Wallgate Ave
- 131 Axlewood Dr
Your Personal Tour Guide
Ask me questions while you tour the home.