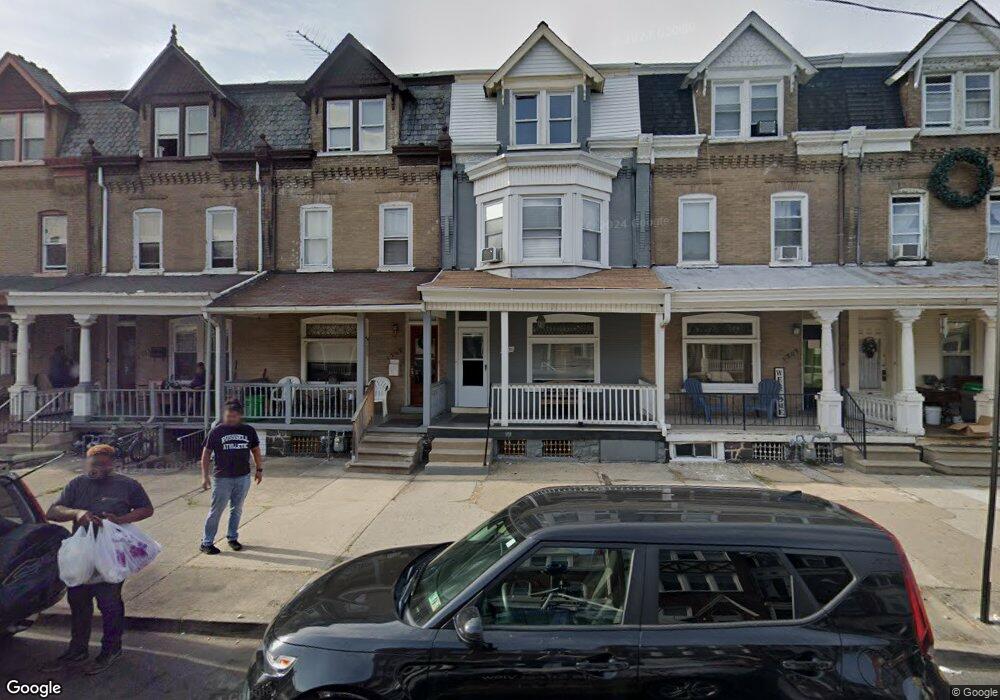
1309 W Chew St Allentown, PA 18102
Center City NeighborhoodEstimated Value: $218,000 - $250,000
5
Beds
2
Baths
1,864
Sq Ft
$126/Sq Ft
Est. Value
About This Home
This home is located at 1309 W Chew St, Allentown, PA 18102 and is currently estimated at $234,141, approximately $125 per square foot. 1309 W Chew St is a home located in Lehigh County with nearby schools including Huntington Elementary School, Luis A. Ramos Elementary School, and San Rafael Junior High School.
Ownership History
Date
Name
Owned For
Owner Type
Purchase Details
Closed on
May 21, 2019
Sold by
Hahalis Alex
Bought by
Neva Rental Propertyone Llc
Current Estimated Value
Home Financials for this Owner
Home Financials are based on the most recent Mortgage that was taken out on this home.
Original Mortgage
$204,000
Outstanding Balance
$179,357
Interest Rate
4.2%
Mortgage Type
New Conventional
Estimated Equity
$54,784
Purchase Details
Closed on
Feb 28, 2005
Sold by
Molina Francisco and Molina Sally A
Bought by
Hahalis Alex
Home Financials for this Owner
Home Financials are based on the most recent Mortgage that was taken out on this home.
Original Mortgage
$76,950
Interest Rate
5.73%
Mortgage Type
Purchase Money Mortgage
Purchase Details
Closed on
Dec 21, 1990
Sold by
George Sara Anne
Bought by
Molina Francisco and Molina Sally A
Purchase Details
Closed on
May 4, 1987
Sold by
Alderfer Scott
Bought by
George Sara Anne
Purchase Details
Closed on
Jan 28, 1987
Bought by
Alderfer Scott
Create a Home Valuation Report for This Property
The Home Valuation Report is an in-depth analysis detailing your home's value as well as a comparison with similar homes in the area
Home Values in the Area
Average Home Value in this Area
Purchase History
| Date | Buyer | Sale Price | Title Company |
|---|---|---|---|
| Neva Rental Propertyone Llc | $264,816 | None Available | |
| Hahalis Alex | $85,500 | Penn Title Inc | |
| Molina Francisco | $65,000 | -- | |
| George Sara Anne | $59,500 | -- | |
| Alderfer Scott | $36,000 | -- |
Source: Public Records
Mortgage History
| Date | Status | Borrower | Loan Amount |
|---|---|---|---|
| Open | Neva Rental Propertyone Llc | $204,000 | |
| Previous Owner | Hahalis Alex | $76,950 |
Source: Public Records
Tax History Compared to Growth
Tax History
| Year | Tax Paid | Tax Assessment Tax Assessment Total Assessment is a certain percentage of the fair market value that is determined by local assessors to be the total taxable value of land and additions on the property. | Land | Improvement |
|---|---|---|---|---|
| 2025 | $2,916 | $90,500 | $6,400 | $84,100 |
| 2024 | $2,916 | $90,500 | $6,400 | $84,100 |
| 2023 | $2,916 | $90,500 | $6,400 | $84,100 |
| 2022 | $2,813 | $90,500 | $84,100 | $6,400 |
| 2021 | $2,757 | $90,500 | $6,400 | $84,100 |
| 2020 | $2,684 | $90,500 | $6,400 | $84,100 |
| 2019 | $2,640 | $90,500 | $6,400 | $84,100 |
| 2018 | $2,468 | $90,500 | $6,400 | $84,100 |
| 2017 | $2,404 | $90,500 | $6,400 | $84,100 |
| 2016 | -- | $90,500 | $6,400 | $84,100 |
| 2015 | -- | $90,500 | $6,400 | $84,100 |
| 2014 | -- | $90,500 | $6,400 | $84,100 |
Source: Public Records
Map
Nearby Homes
- 217 N 13th St
- 1326 W Turner St
- 1336 W Turner St
- 1416 W Chew St
- 231 N 12th St
- 1141 Emmett St
- 127 N Franklin St
- 42 N 13th St
- 329 N 15th St
- 36 N Jefferson St
- 35 N Jefferson St
- 24 N 13th St
- 1420 W Linden St
- 1357 W Liberty St
- 131 N Poplar St
- 112 N Poplar St
- 140 N 11th St
- 21 N Jefferson St
- 1429 W Liberty St
- 1035 W Turner St
- 1311 W Chew St
- 1313 W Chew St
- 1305 W Chew St
- 1315.5 Chew
- 1303 W Chew St
- 1315 W Chew St
- 1301 W Chew St
- 1317 W Chew St
- 314 N 13th St
- 1319 W Chew St
- 1319 W Chew St
- 1321 W Chew St
- 318 N 13th St
- 1323 W Chew St
- 320 N 13th St
- 320 N 13th St Unit 3
- 1312 W Chew St
- 1308 W Chew St
- 1325 W Chew St
- 1308-1/2 W Chew St